Ethereum, Dogecoin, Uniswap Price Analysis: 13 February

With the market-wide retracement in the last few days, the Bitcoin fear and greed index saw a slight pullback as it kept hovering into the ‘fear’ zone. Ethereum and Dogecoin witnessed an up-channel breakdown on their 4-hour charts. Uniswap fell by marking a reversal pattern. Any bullish comebacks are likely to find a barrier near the $11.1-mark.
Ether (ETH)
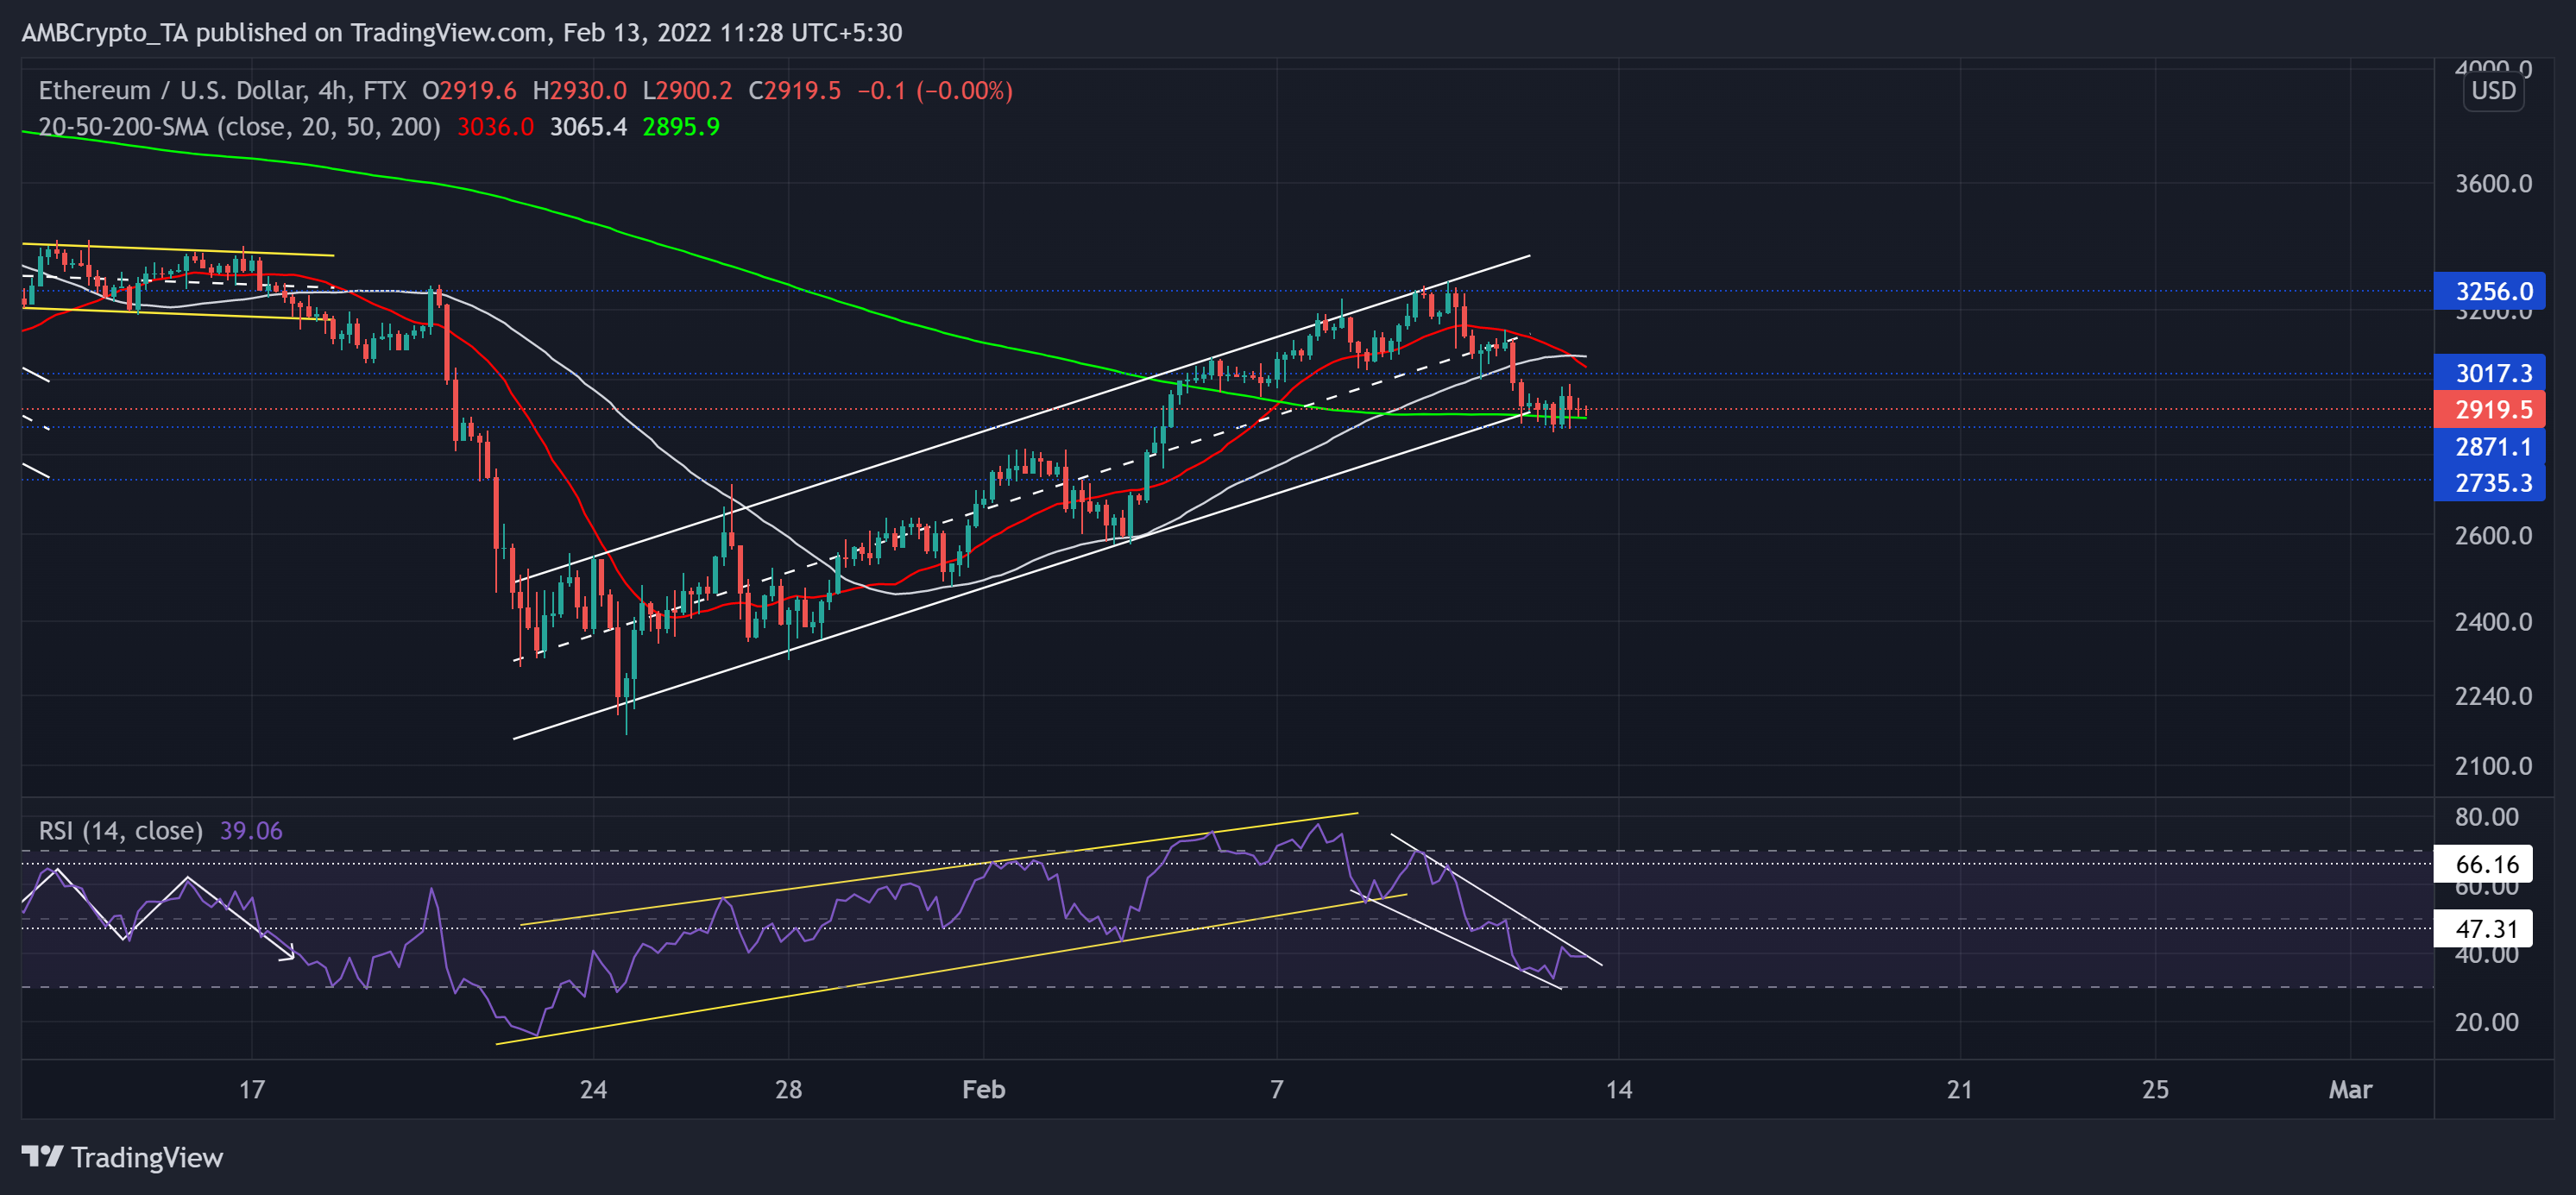
Since falling below the $4,000-mark, ETH bears initiated substantial sell-offs. As a result, it touched its six-month low on 24 January.
Since then, it saw a 51.8% ROI while breaching multiple supports (previous resistance) to poke its three-week high at the $3,200-level. However, ETH noted an 11.3% retracement in just the last three days. Thus, breaking down from the up-channel (white). Moreover, the 20 SMA (red) moved below the 50 SMA (grey), affirming a decreasing bullish edge. Now, immediate support stood at the $2,800-level while resistance stood at the $3,017-mark.
At press time, ETH was trading at $2,919.5. The bearish RSI undertook a steep fall from its up-channel (yellow). After testing the 47-mark twice, it fell toward the oversold region. Any close above the falling wedge (white) could lead to a test of its immediate resistance.
Dogecoin (DOGE)
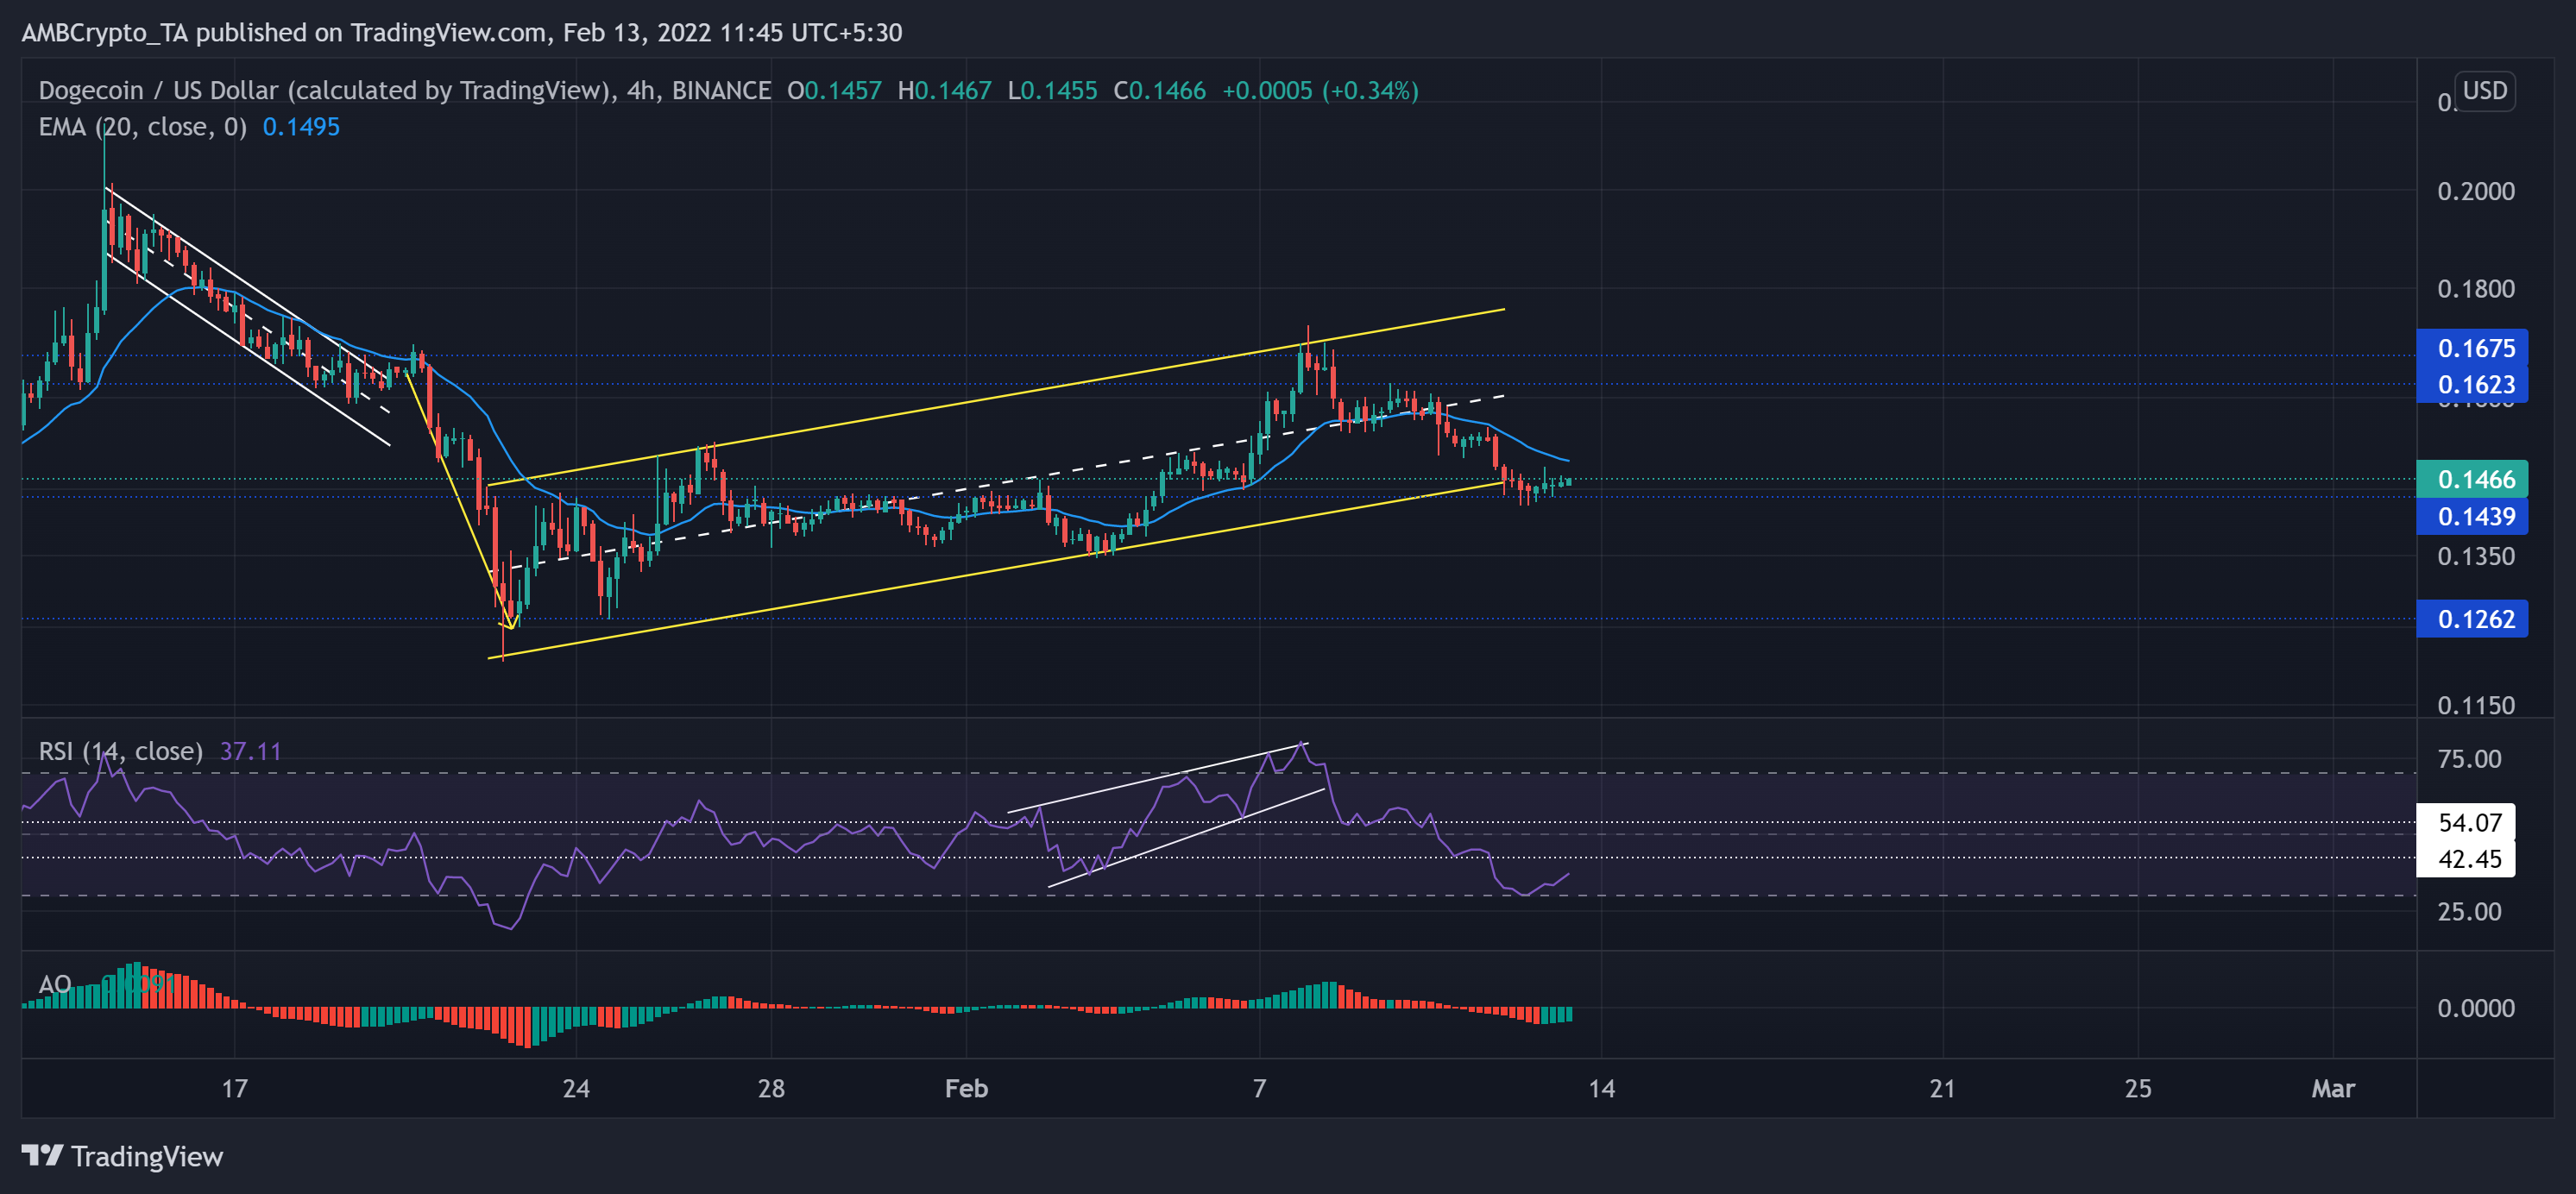
The altcoin saw a 44.03% fall (from 14 January) and hit its nine-month low on 22 January. Since then, DOGE recovered its previous losses during the next few weeks.
The recovery phase marked an ascending channel (yellow, reversal pattern) on its 4-hour chart. While the $0.167-mark stood sturdy, DOGE saw a 15.7% five-day pullback. Now, the immediate hurdle for the bears stood near the $0.143-level. The bulls may face a barrier near the 20 EMA (cyan).
At press time, DOGE traded at $0.1466. After heading into the overbought region, the RSI saw a patterned breakout and lost the 42-mark level. This trajectory depicted a strong bearish influence. Further, the AO projected a bearish edge while displaying their decreasing vigor over the past day.
Uniswap (UNI)
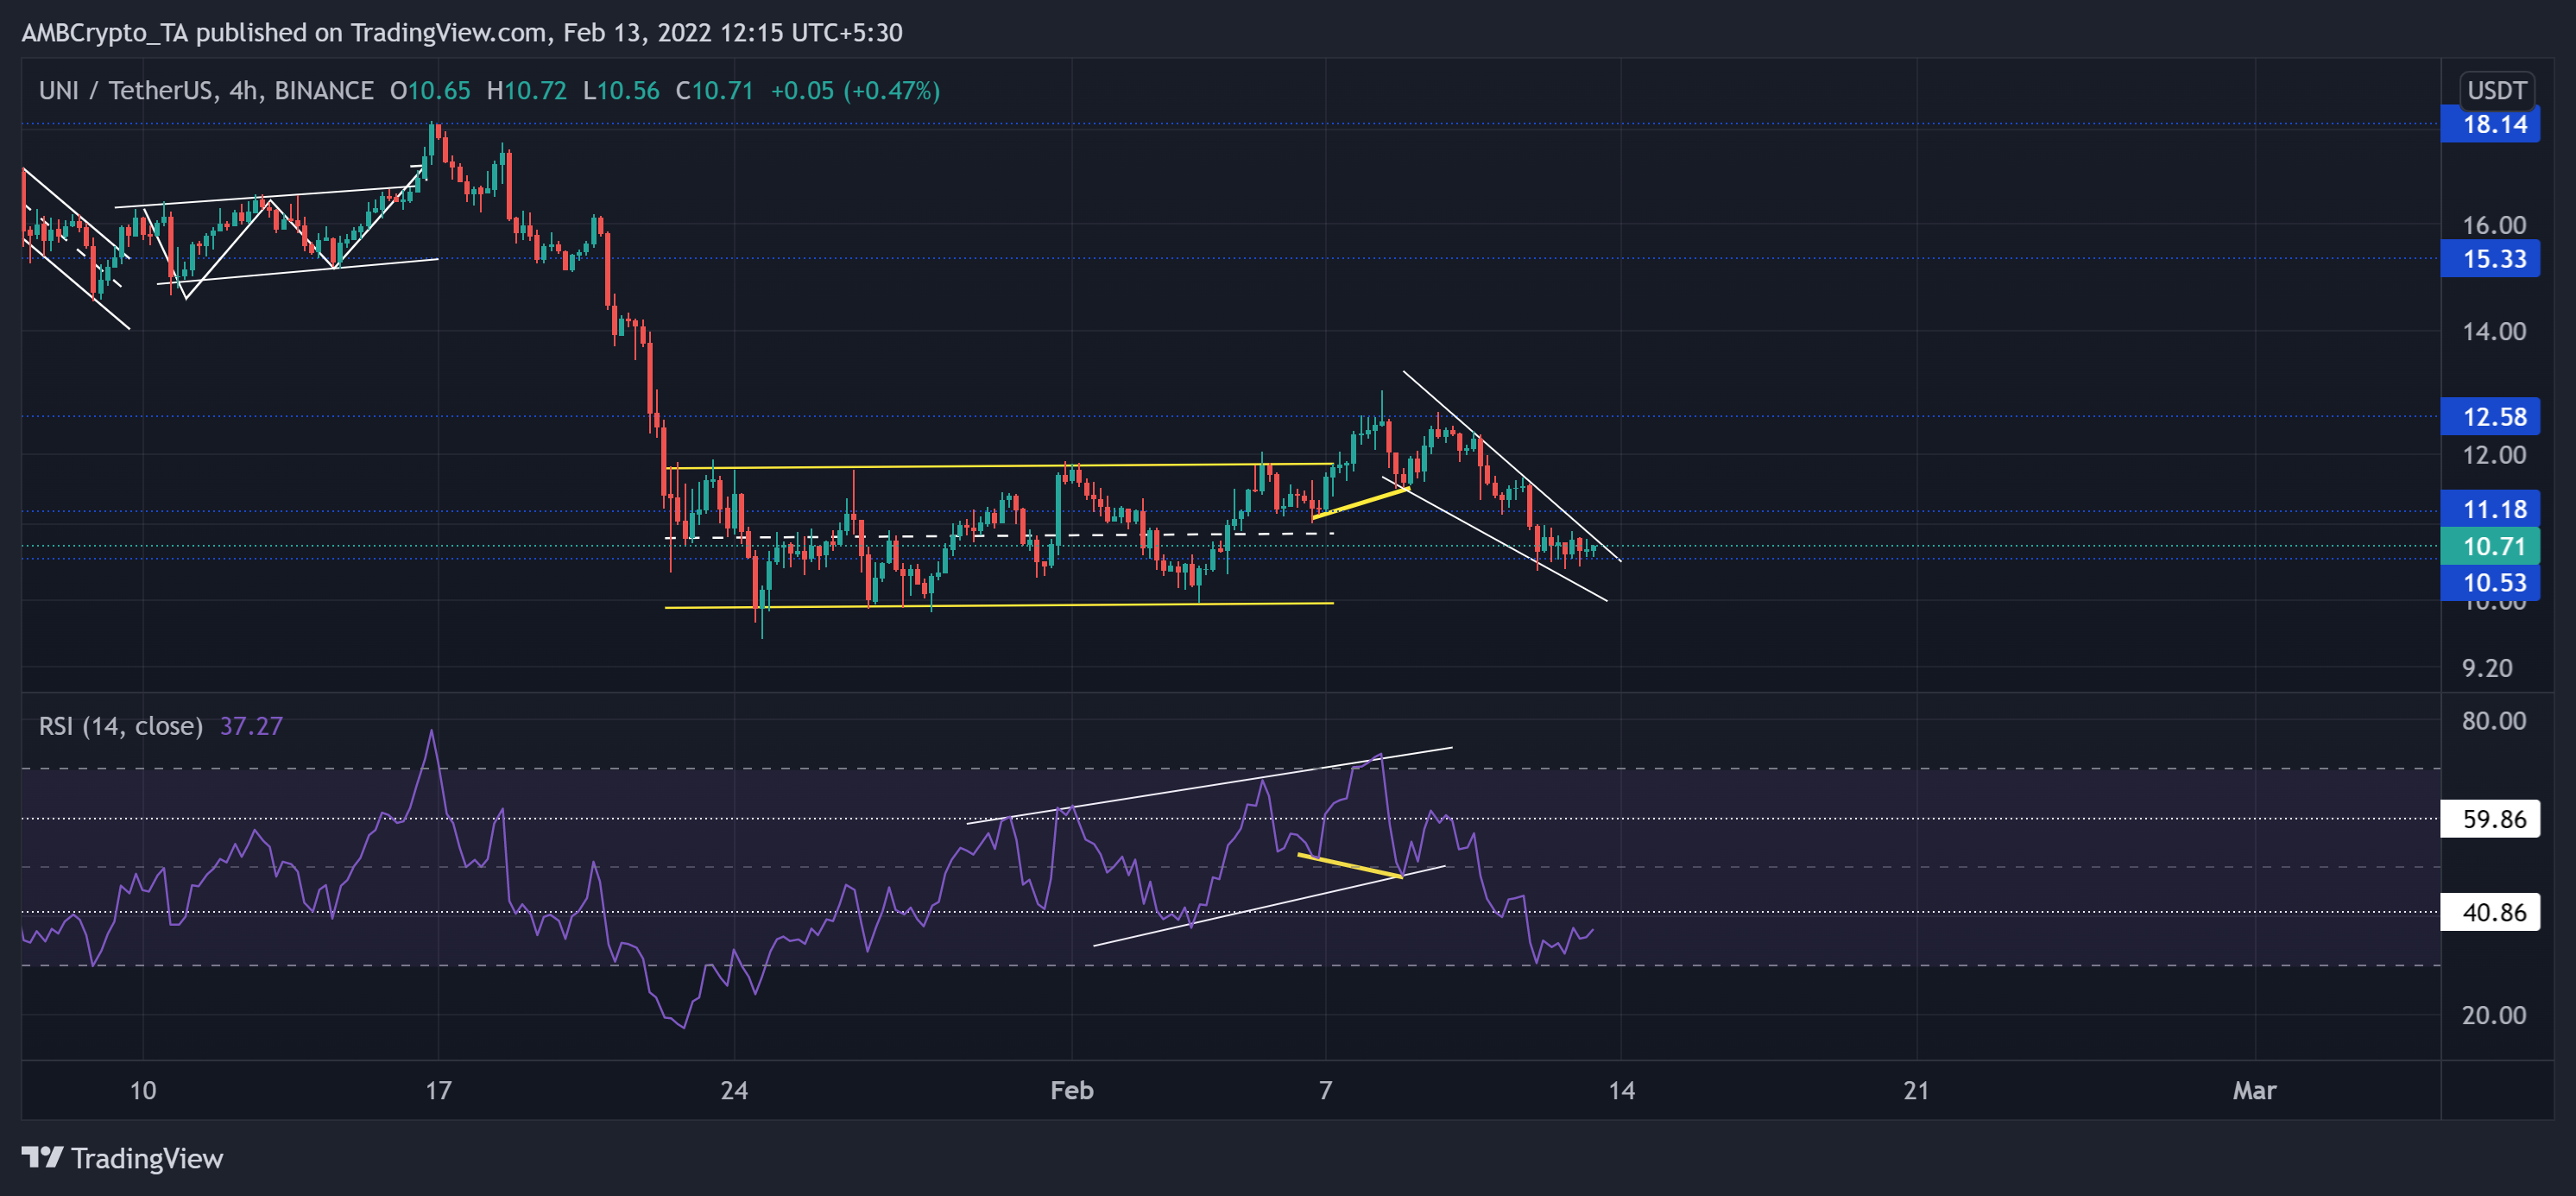
Ever since falling from the $18.14-mark, UNI bulls have not been able to propel a sustained close above the $12.5-zone. The alt noted a 47.51% fall (from 17 January) and touched its one-year low on 24 January.
Since then, UNI consolidated in a rectangle (yellow) until a breakout on 7 February after bullishly diverging with its RSI. Nevertheless, the bears upheld the $12.5-mark. Thus, the altcoin saw an over 18% retracement in just the last five days, forming a falling wedge (white) on its 4-hour chart. Any close below the $10-mark (immediate support) would propel a retest of the lower trendline of the wedge.
At press time, the alt was trading at $10.81. Since facing a hurdle near the 59-point, the RSI lost even the 40-mark. While saying in favor of sellers, it endeavored to test its resistance.