Ethereum, Dogecoin, Waves Price Analysis: 27 January

Following the king coin’s footsteps, ETH oscillated in an up-channel (reversal pattern) whilst trying to retest the $2,550-level. Further, Dogecoin also formed a reversal pattern after displaying a decent recovery. But it lacked trend-altering volumes.
On the other hand, Waves saw a noteworthy breakout and pulled back from the $11-mark.
Ether (ETH)
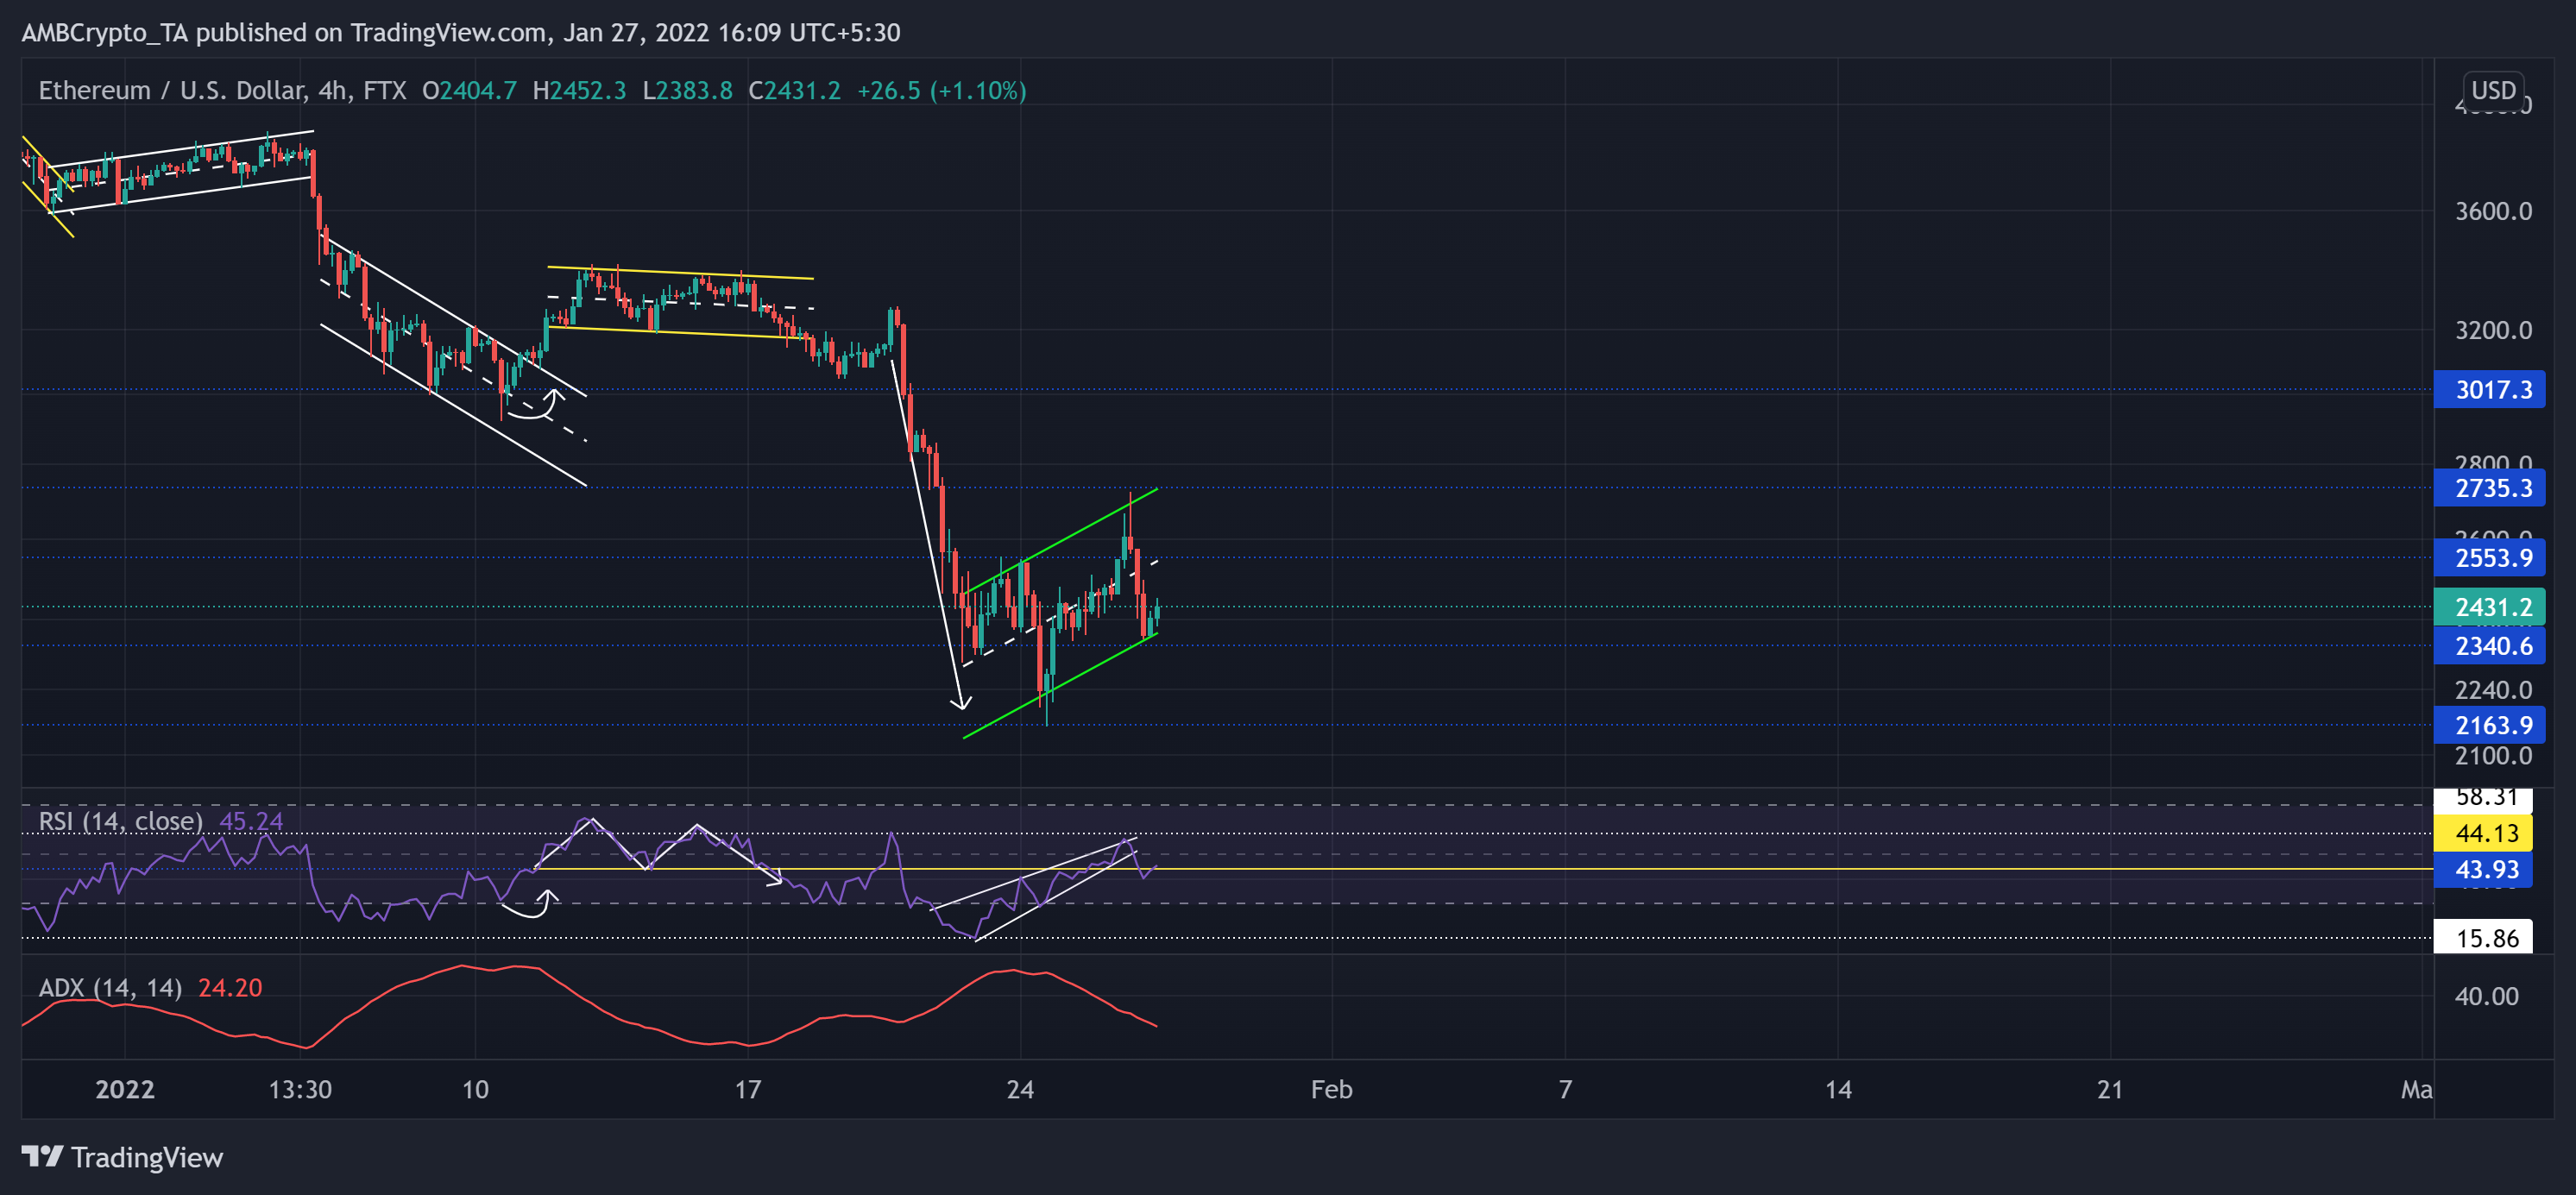
As curbing the ‘fear’ emotion kept getting more challenging for the bulls, the recent sell-off heightened the bearish sentiment. Upholding the $3,000-mark as support was crucial for the buyers. However, ETH registered a 33.84% loss (from 20 January high) and touched its six-month low on 24 January.
Over the past few days, the king alt saw a consolidation phase after a sharp plunge. Thus, forming a bearish flag on its 4-hour chart. Now, the immediate resistance stood near the half-line of the up-channel (green).
At press time, ETH was trading at $2,431.2. Following the broader sell-off, the RSI saw an impressive revival 32 point revival from its 22-month low (on 22 January). But it broke down from the rising wedge and could not find a close above the half-line. The ADX, however, was on a downtrend and displayed a weak directional trend for the alt.
Dogecoin (DOGE)

After attaining its month-long high on 14 January, the sellers stepped in at $0.1919-mark. Thus, the altcoin saw a 41.18% retracement and hit its nine-month low on 22 January.
Since then, the recovery phase marked an up-channel (yellow, reversal pattern) while testing the $0.1456-mark immediate resistance. During this phase, DOGE gained over 18%.
At press time, DOGE was trading at $0.1425. After the recent revival, the RSI was finally able to sustain itself above the 42-level. But it still faced resistance near the half-line. Also, the CMF was yet to find a close above the zero line despite the recent recovery.
WAVES

WAVES steeply fell since mid-October as it marked three down-channels and snapped off multiple resistance points. The altcoin lost nearly 71.4% of its value from 15 October to date.
Over the past few days, bears breached the $14.3 (18-week support) and flipped it to resistance. Soon after, the down-channel breakout fueled a short-term bullish push above the 20-50 SMA. However, it saw a strong pullout immediately from the $11-mark. Interestingly, WAVES added more than 44% to its value on 26 January after a descending channel (green) breakout.
At press time, WAVES traded at $9.8924. The RSI dipped from the oversold region to the overbought territory on 26 January. Since then, it seemed to find half-line support. Although the AO formed bullish twin peaks below the equilibrium, the bulls couldn’t initiate a sustained rally.


