The odds on Ethereum downtrend’s persisting are…
At the time of writing, Ethereum's lower high at $1778 needs to break before the market structure can shift bullish.

Disclaimer: The information presented does not constitute financial, investment, trading, or other types of advice and is solely the writer’s opinion.
- The market structure was bearish and a downtrend was in progress.
- The selling pressure remained strong and a reversal was not yet in sight.
A week ago on 7 June, Ethereum prices climbed hopefully toward the $1900 mark. A previous report highlighted the $1890-$1930 as a stiff zone of resistance. Since then, ETH has posted losses on the price charts.
Read Ethereum’s [ETH] Price Prediction 2023-24
The total value of ETH 2.0’s Deposit Contract reached an ATH on 13 June, signaling long-term bullish confidence. Yet the short-term charts exuded bearishness. A drop below the $1700 level appeared likely over the coming days.
The liquidity in the $1780 area could get tested once more
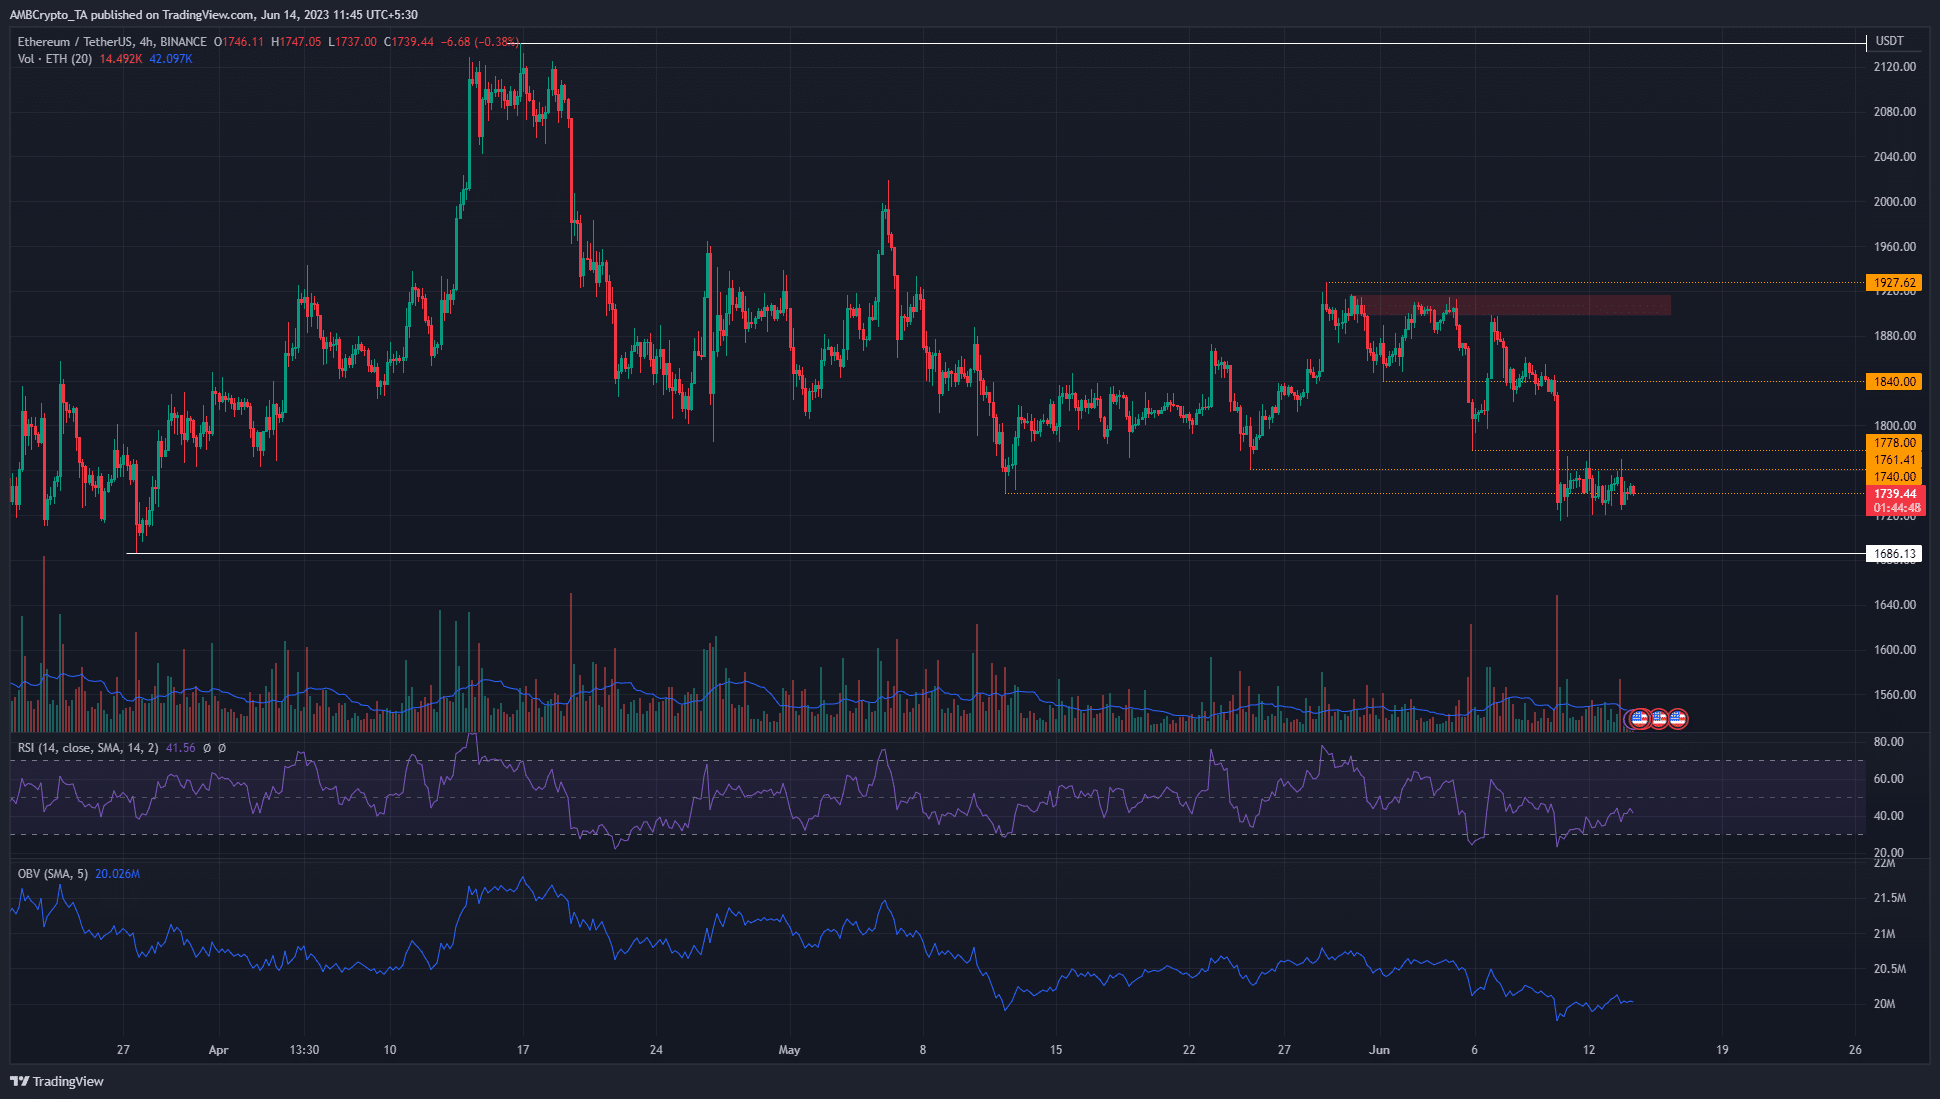
The 4-hour charts showed a clear series of lower highs and lower lows since 5 June, signaling a downtrend in progress. At the time of writing, the lower high at $1778 was the one to break before the market structure can shift bullish.
Yet, such a move would not be indicative of a shift in the downtrend. Traders must beware of a bull trap in the vicinity of $1800 before another turn downward. The $1700 is a psychological support level. The $1685-$1715 area has been a significant zone since May 2021 and will likely be tested once more.
The RSI on the 4-hour chart was beneath neutral 50 to highlight bearish momentum. The OBV has also been in a downtrend since early June, showing that the bears have been dominant for a while now.
Hence, short sellers can look to enter scalp trades upon a retest of the $1780-$1800 area. A lower timeframe rejection and increased trading volume would suggest that another drop in Ethereum prices was imminent.
The majority of speculators were sidelined but the rest were firmly bearish
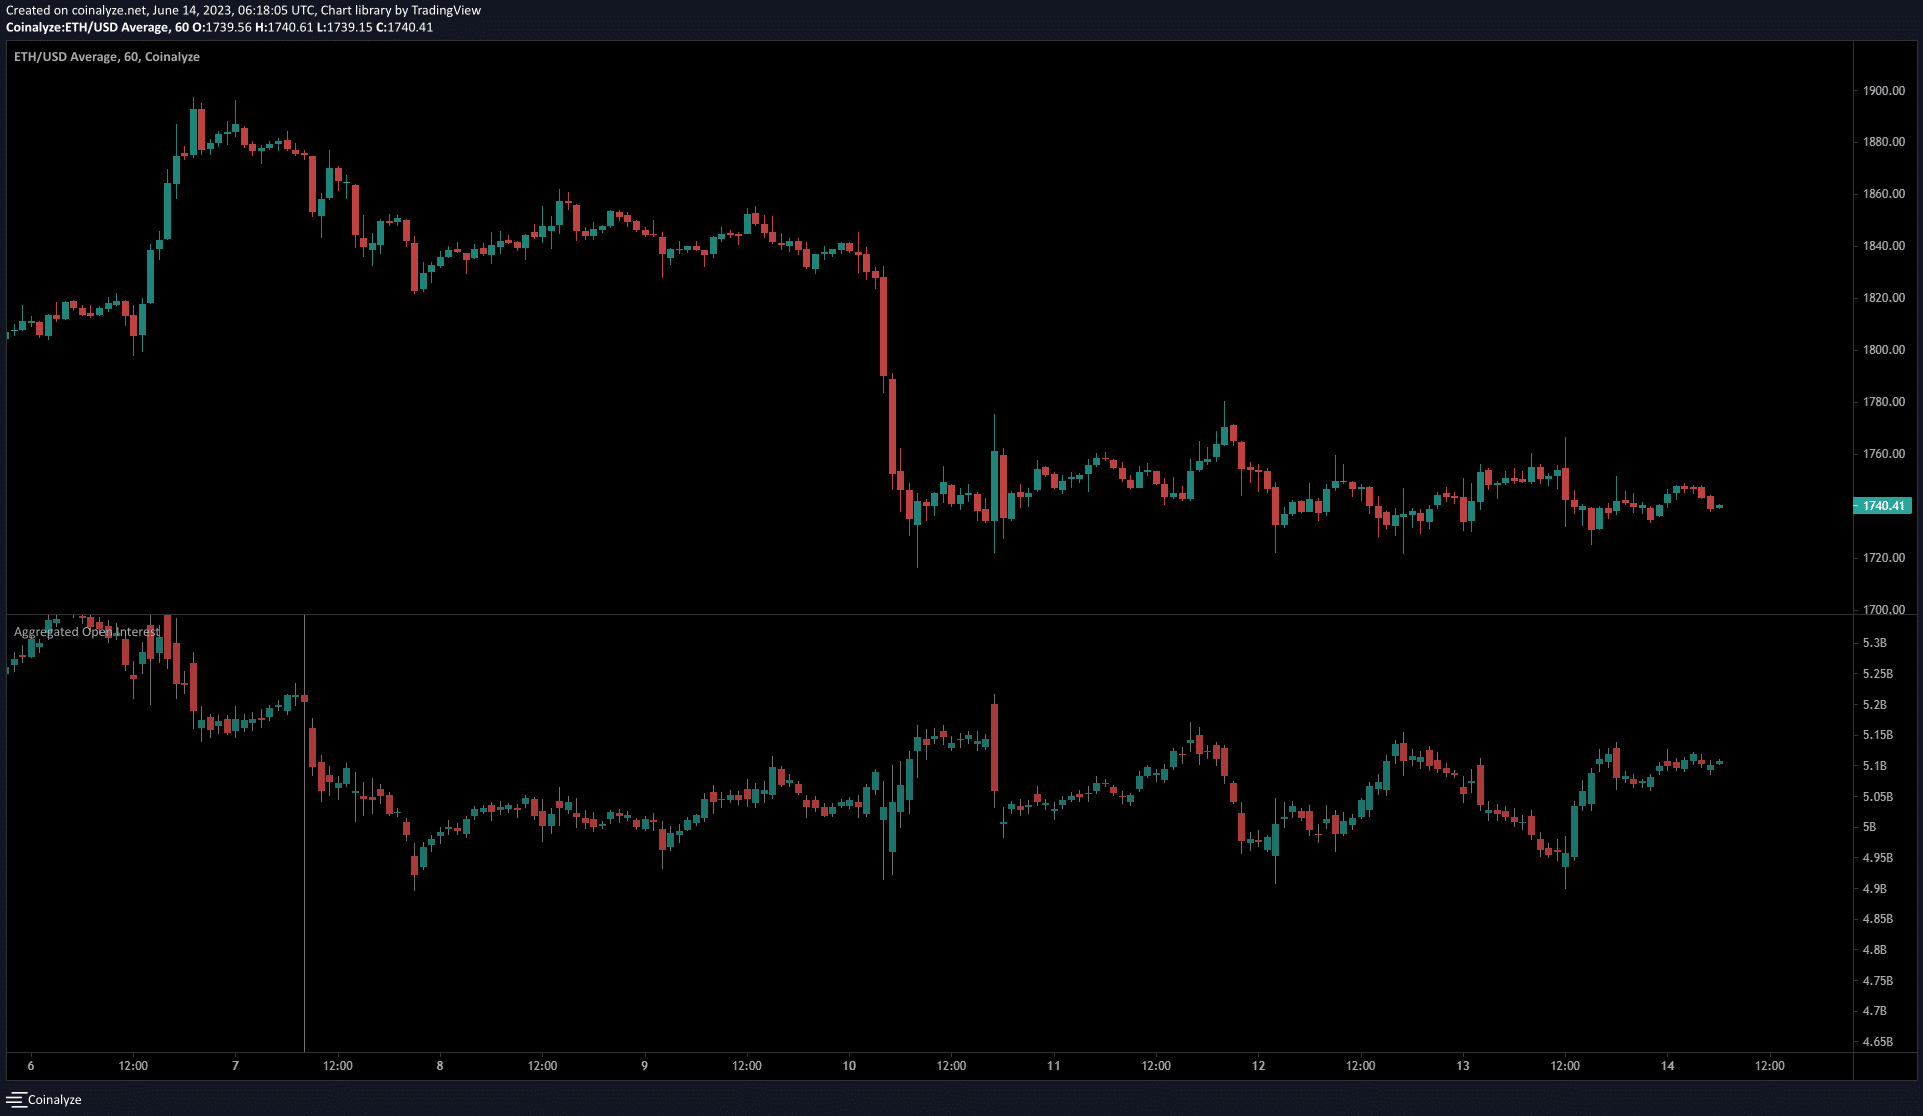
The data from Coinalyze showed that ETH’s Open Interest was relatively flat since 9 June. Previously, the Open Interest was in a downtrend from 5 June. This lack of trend on the OI suggested that a number of participants could be sidelined.
For instance, during the price rally in early May, the OI increased by around $1 billion when ETH climbed from $1815 to $2000.
How much are 1, 10, or 100 ETH worth today?
In the past week the OI remained within a much tighter range. It also showed bearish dominance. On 12 and 13 June, the OI rose alongside falling prices. Although Ethereum did not possess a true downtrend in the past two days, the OI chart emphasized bearish sentiment.


