Ethereum ETFs struggle, but BlackRock’s ETHA defies bearish trend – How?

- ETH ETFs faced outflows, while BlackRock’s ETHA neared $1 billion in inflows.
- Grayscale’s GBTC and ETHE saw significant outflows, while BlackRock’s IBIT attracted inflows.
Ethereum [ETH] Exchange-Traded Funds (ETFs) have struggled to match the performance of Bitcoin [BTC] ETFs.
While Bitcoin ETFs have frequently set records with substantial inflows, Ethereum ETFs have lagged behind.
BlackRock’s Ethereum ETF update
After the market closed on the 9th of August, ETH ETFs experienced net outflows totaling $89.7 million, according to Farside Investors.
Interestingly, while other Ethereum ETFs, such as Grayscale’s ETHE, have faced continuous outflows since their launch, BlackRock’s ETHA is approaching a significant milestone.
As of the 9th of August, ETHA has accumulated $901 million in net inflows and is nearing the $1 billion mark.
Execs weighing in
That being said, Nate Geraci, President of The ETF Store, expressed strong confidence in ETHA, and said,
“iShares Ethereum ETF has taken in $900+mil in < 3 weeks…Pretty much a lock to hit *$1bil* this week IMO. As mentioned previously, ETHA already top 6 launch of 2024 (4 of 5 others are spot btc ETFs).”
However, not everyone seemed to be content with this news, as highlighted by the Rug Radio creator, Daito who said,
“Can’t believe institutional investors are buying this sh*tcoin.”
Grayscale’s ETHE breaks record
On the other hand, Grayscale’s ETHE is approaching a staggering milestone, with outflows projected to reach $2.5 billion.
It’s not just ETH ETFs facing challenges; Grayscale’s Bitcoin ETF (GBTC) has also been experiencing a significant outflow streak, accumulating a total outflow of $19.451 billion since its launch.
In contrast, BlackRock’s Bitcoin ETF (IBIT) has seen a robust inflow streak, totaling $20.317 billion over the same period.
Impact on ETH’s price
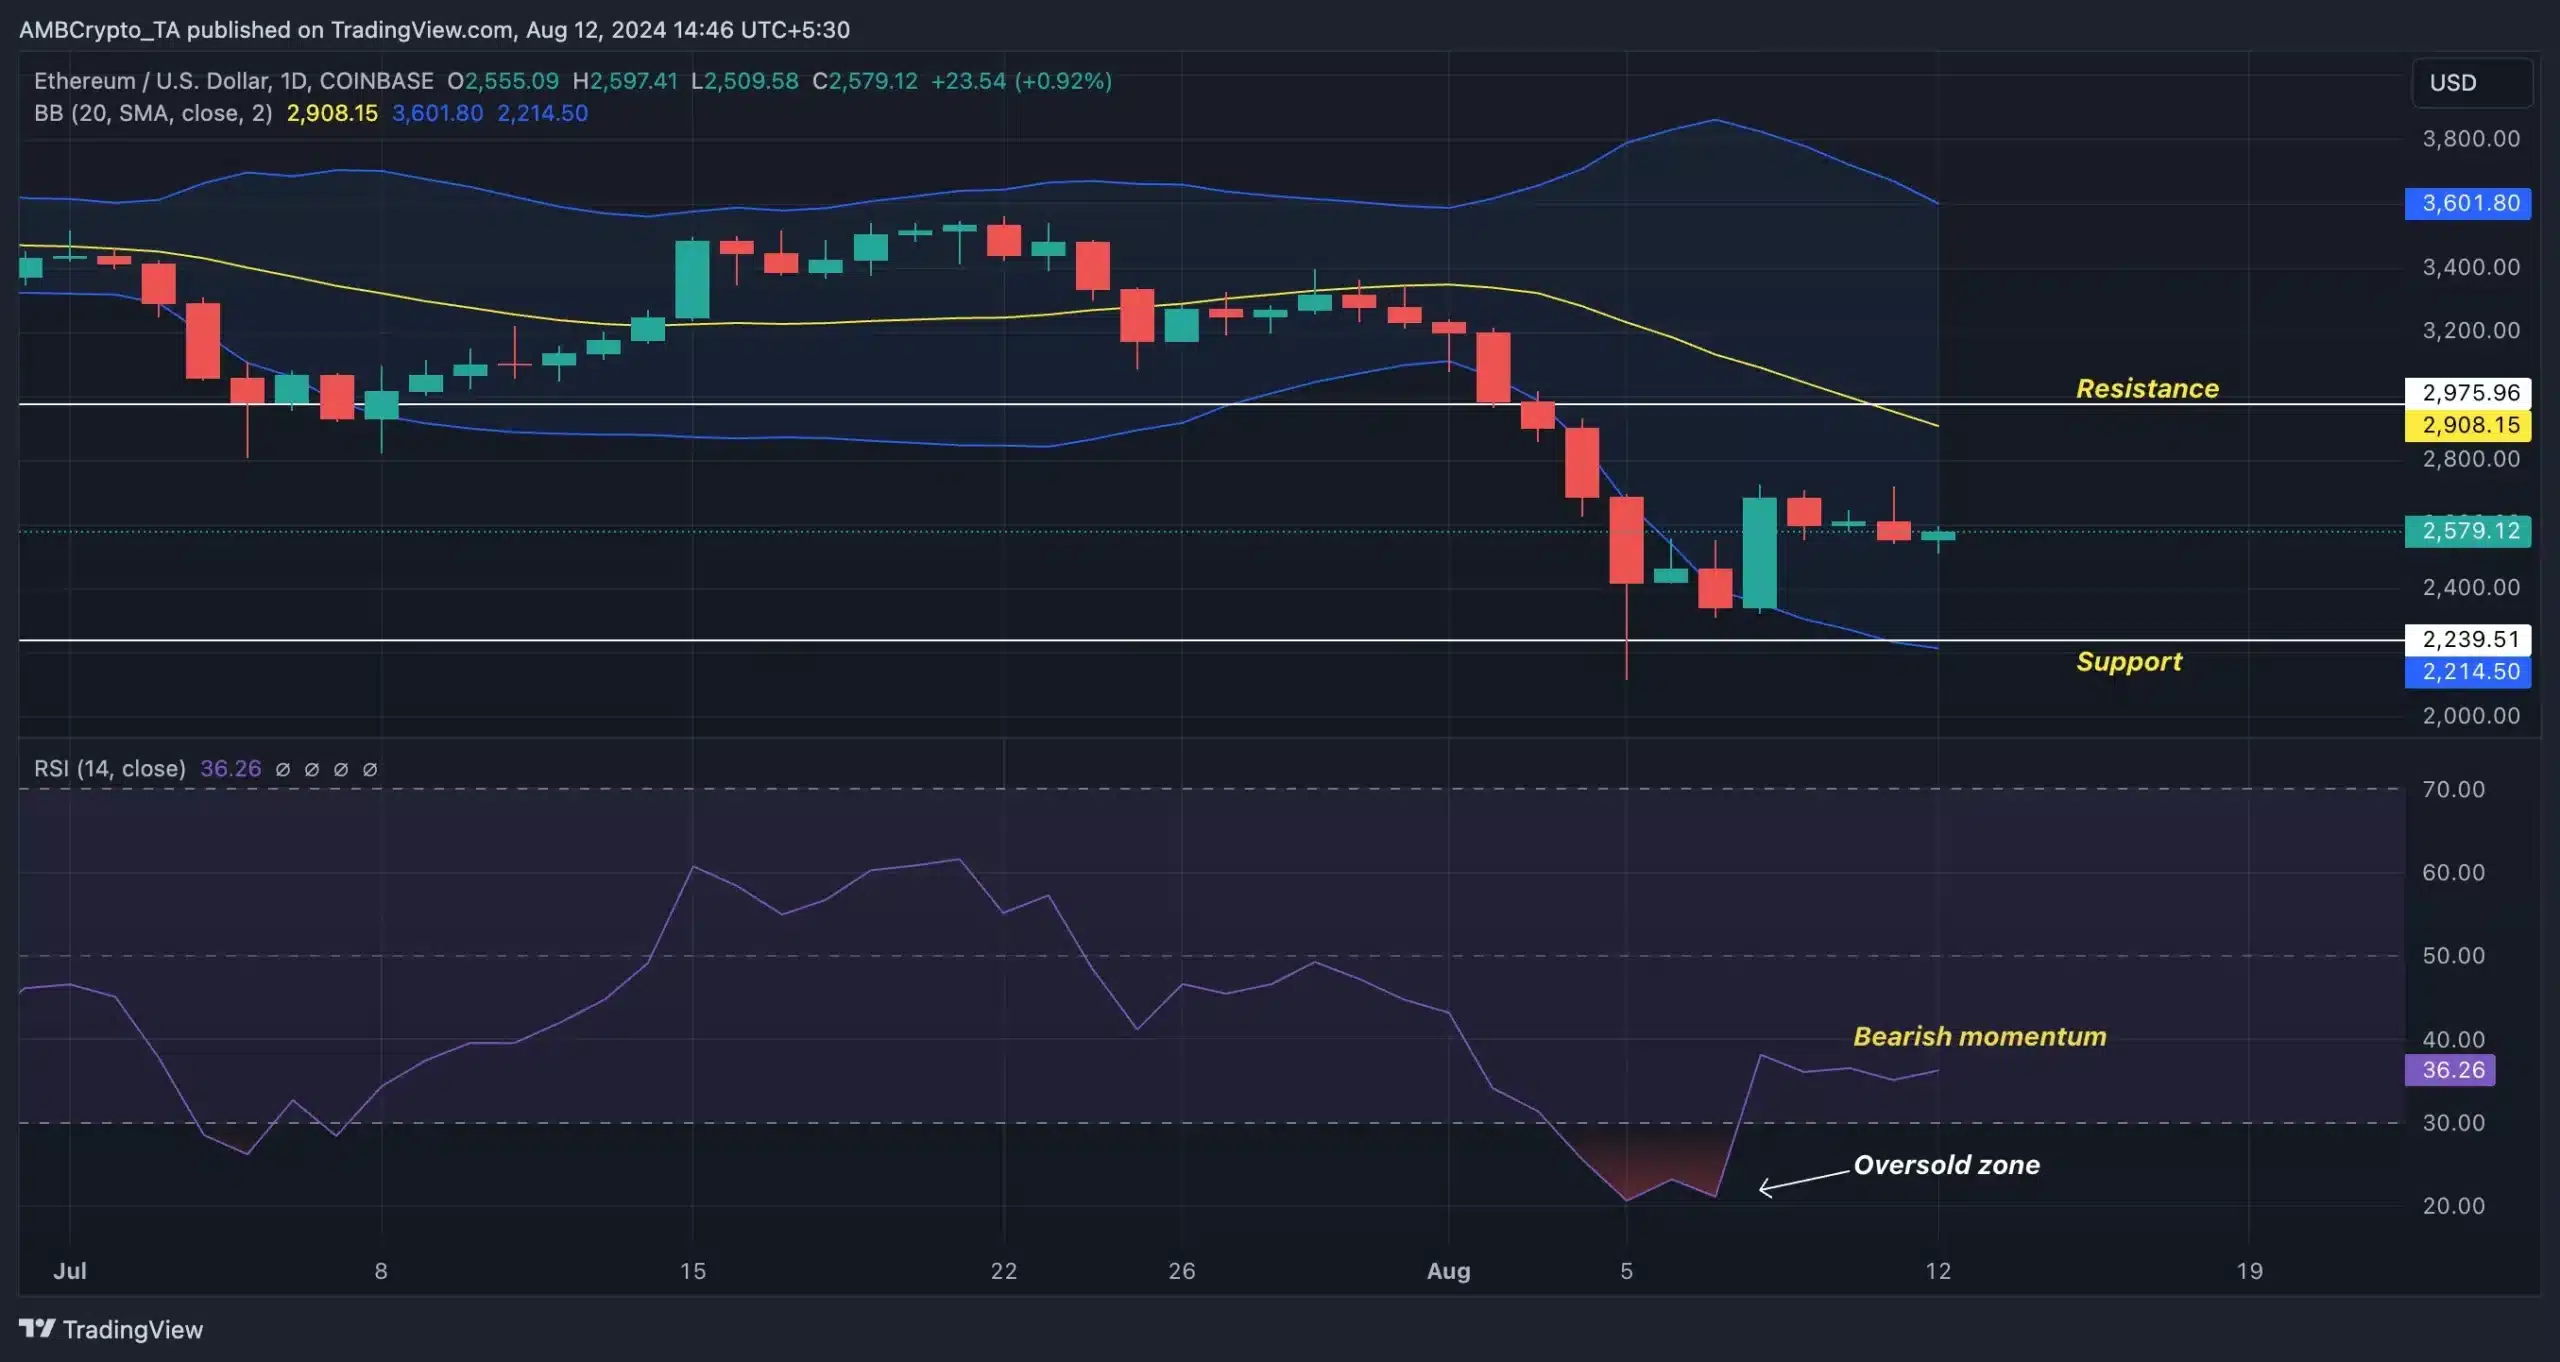
At press time, ETH was struggling to cross past the $3K level. Per CoinMarketCap, ETH was down by 4.53% at this time, trading at $2,575.71.
The Relative Strength Index (RSI) further confirmed the bearish trend as it stood below the neutral 50 level at 36. However, the expanded Bollinger Bands indicate a potential trend reversal might be on the horizon.


