
- The largest ETH ETF, Grayscale, had a single-day outflow of $210 million.
- ETH also turned bearish, and most metrics hinted at a continued price drop.
Exchange Traded Funds (ETFs) have gained much traction since the beginning of this year with the launch of Bitcoin [BTC] ETFs. Things got even better over the last week as Ethereum [ETH] ETFs started trading.
Therefore, let’s have a look at how these two ETFs are faring against each other.
BTC ETFs vs. ETH ETFs
Since its launch, Bitcoin ETFs have witnessed major inflows and relatively much lower outflows. The Bitcoin spot ETF had a total net inflow of $124 million on 29th July and continued to have net inflow for four consecutive days.
BlackRock ETF IBIT had an inflow of $206 million. However, the magnitude of inflows has declined over the last few weeks.

Source: SoSoValue
While BTC’s average netflow remained positive, Ethereum ETFs had a different fate.
Ethereum spot ETF had a total net outflow of $98.2856 million on 29th July and continued to have net outflows for four consecutive days.
Grayscale ETF ETHE, the largest ETH ETF, had a single-day outflow of $210 million. Nonetheless, the second largest ETH ETF registered an inflow of $4.8967 million.

Source: SoSoValue
Impact of ETFs on Ethereum
The outflow over the past four consecutive days had a negative impact on the king of cryptos’ chart. According to CoinMarketCap, ETH’s price dropped by more than 3% last week.
The bearish price trend continued in the last 24 hours as the token’s value plummeted by over 1%. At the time of writing, ETH was trading at $3,322.91 with a market capitalization of over $399 billion.
AMBCrypto then checked Santiment’s data to better understand what’s going on with the token. We found that selling pressure on it increased as its active deposits went up.
The fact that investors were selling ETH was further proven by the increase in its supply on exchanges over the last seven days.
Nonetheless, after a major dip, Ethereum’s MVRV ratio improved on the 29th of July, which can be inferred as a bullish signal.
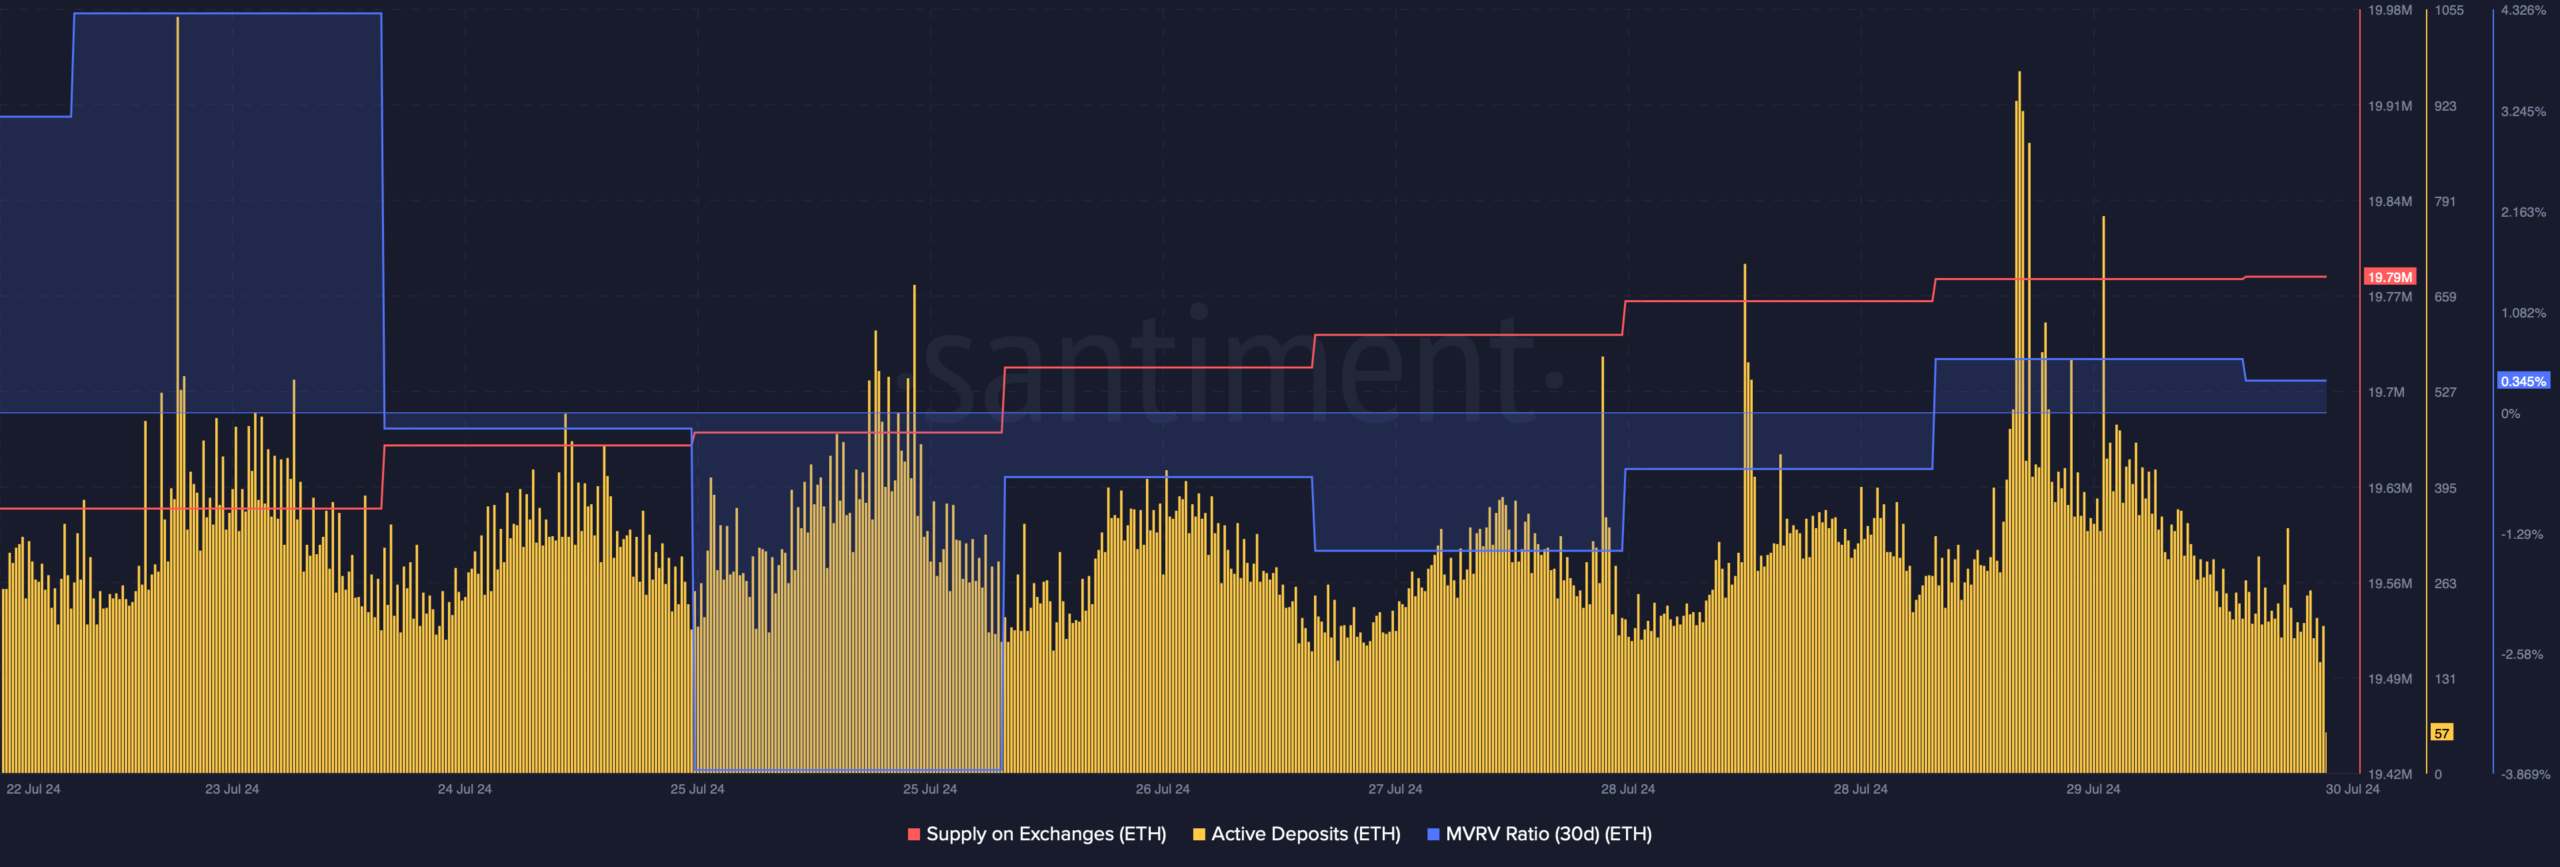
Source: Santiment
The technical indicator Relative Strength Index (RSI) registered a sharp uptick. This indicated that the chances of ETH’s price turning bullish again were high.
Nonetheless, the Money Flow Index (MFI) remained bearish as it went southwards.
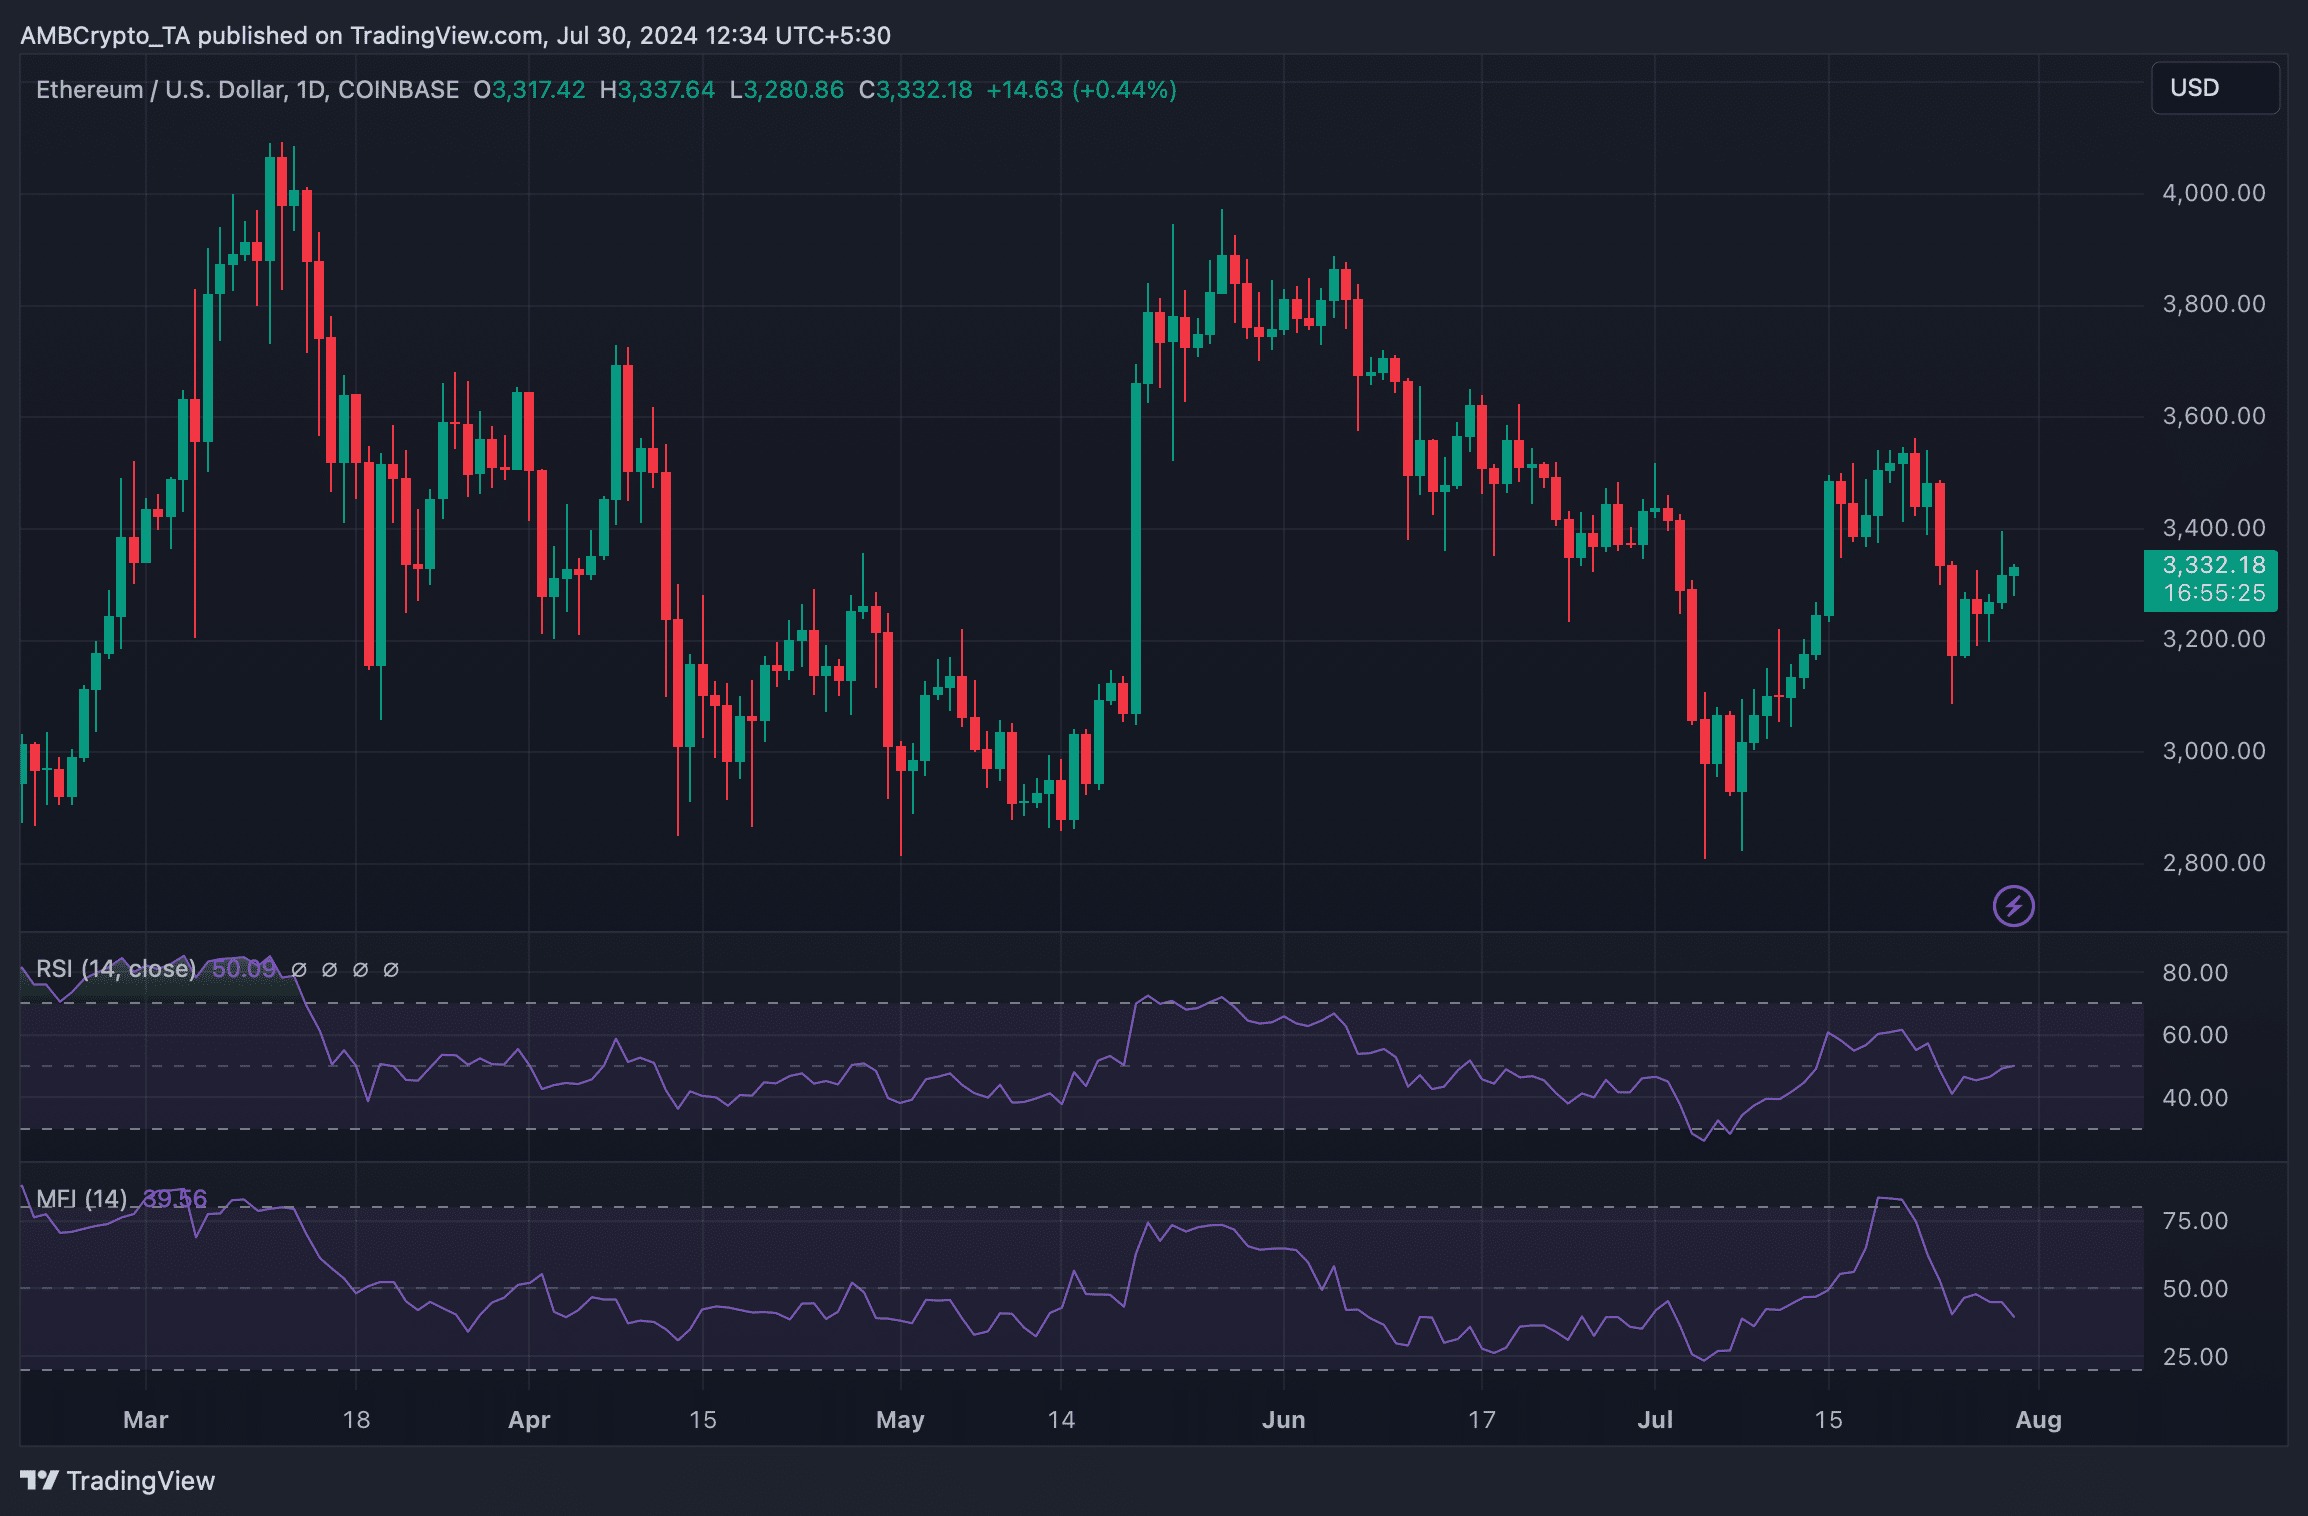
Source: TradingView
Read Bitcoin’s [BTC] Price Prediction 2024-25
While ETH’s price dropped, Bitcoin also followed a similar trend. As per CoinMarketCap, BTC was down by nearly 4% in the last 24 hours.
At press time, it was trading at $66,829 with a market cap of $1.31 trillion.