Analysis

Ethereum [ETH] price prediction is bearish in the short-term: Here’s why
Posted:
Journalist
![Ethereum [ETH] price prediction is bearish in the short-term: Here's why](https://ambcrypto.com/wp-content/uploads/2025/02/Ethereum-Featured-3-1200x675.webp)
- The ETH price action across timeframes showed weakness from buyers.
- Ethereum needs to reclaim $2.9k as support to begin to shift this outlook.
In an earlier analysis, it was detailed how Ethereum [ETH] faced an uphill battle at the $2.8k resistance. Selling pressure in the spot ETFs last week was attributed to profit-taking.
The Korea Premium Index had risen, implying increased demand from the East Asian crypto giant.
ETH price prediction

Source: ETH/USDT on TradingView
The 12-hour chart showed that the selling pressure over the past month had taken the 12-hour OBV to a multi-month low.
This finding was not particularly alarming — the OBV’s trends shift across timeframes, and the 1-day and 3-day OBV remained flat since December instead of trending downward.
The price action structure was firmly bearish, but the RSI was just below neutral 50. Moreover, the $2.8k level was a significant higher timeframe horizontal level. The bulls lacked the strength to reclaim this resistance.
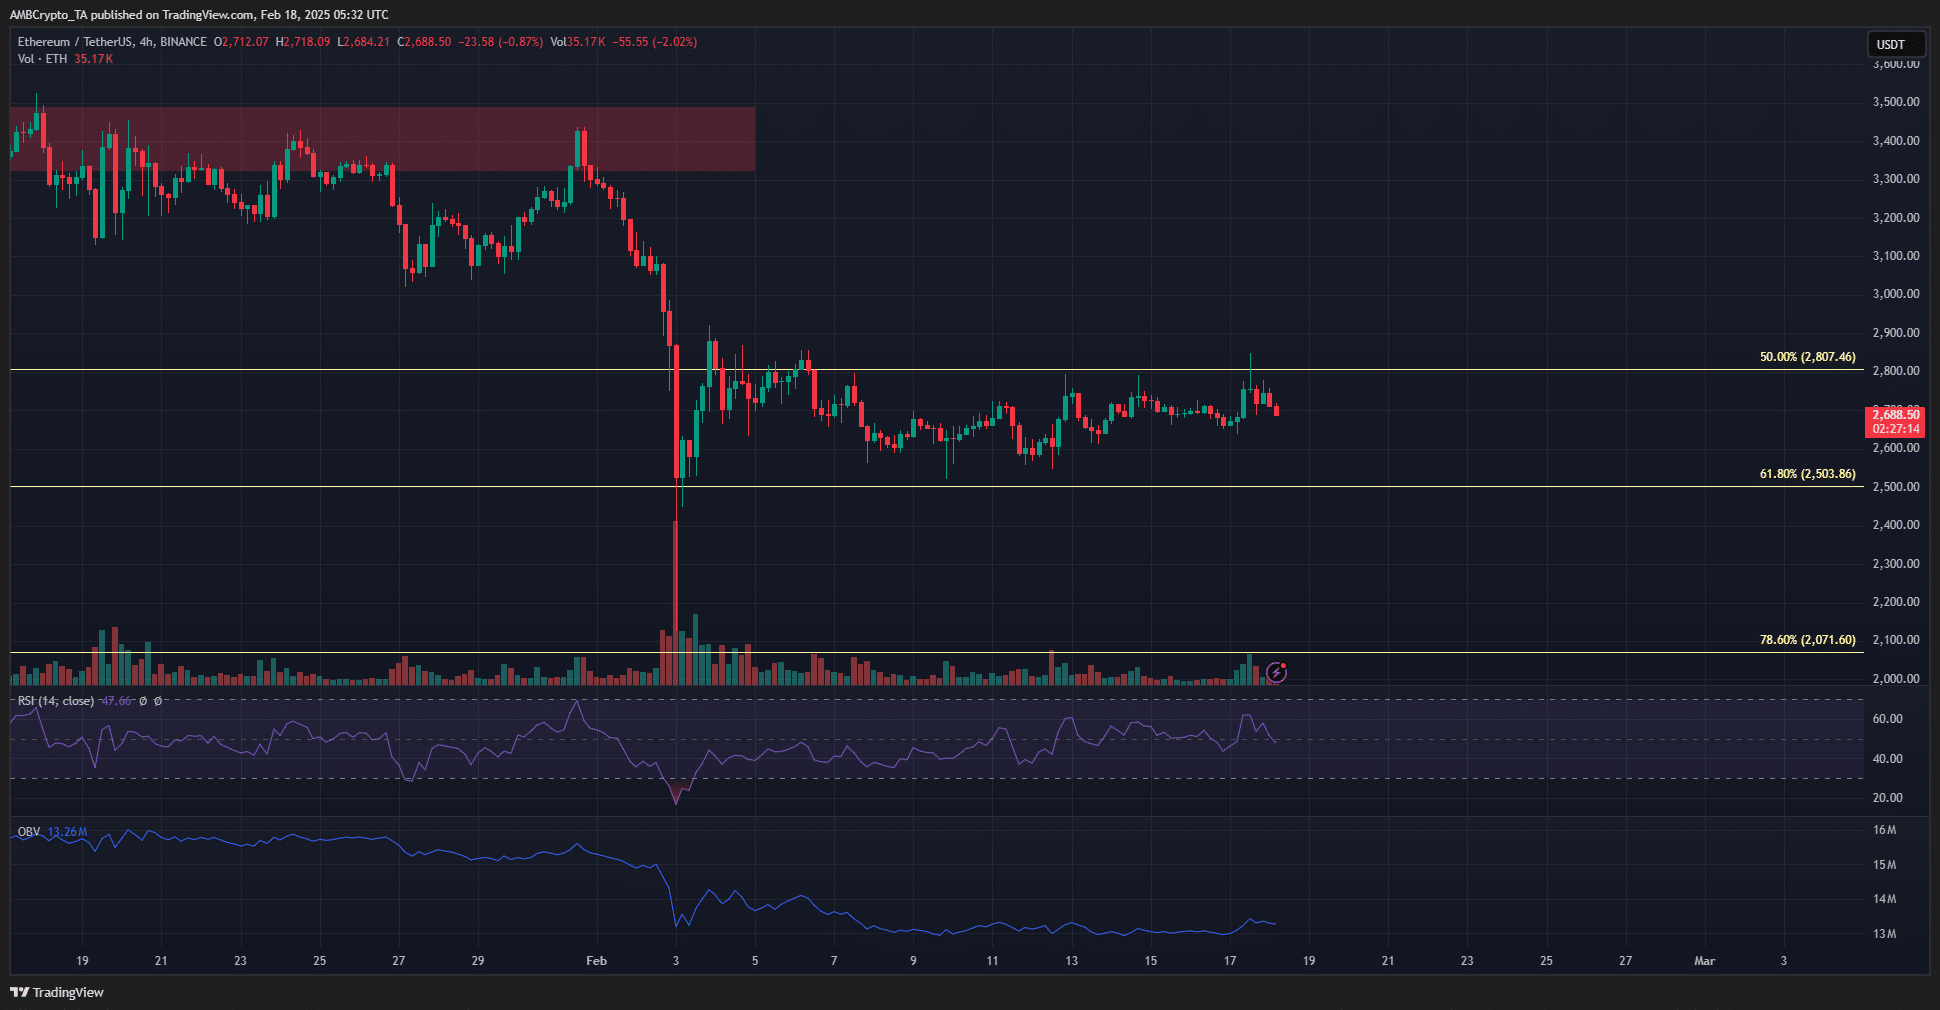
Source: ETH/USDT on TradingView
The 4-hour chart reinforced the 12-hour chart’s findings. The buying pressure in recent weeks has been insubstantial. Even though the RSI poked its head above 50, the bearish structure remained intact.
One slight encouragement was that ETH had formed higher lows over the past week. This does not mean too much without a breach of the recent lower high at $2,880.
The lack of buying and momentum but slow progress higher set the stage for a liquidity hunt.
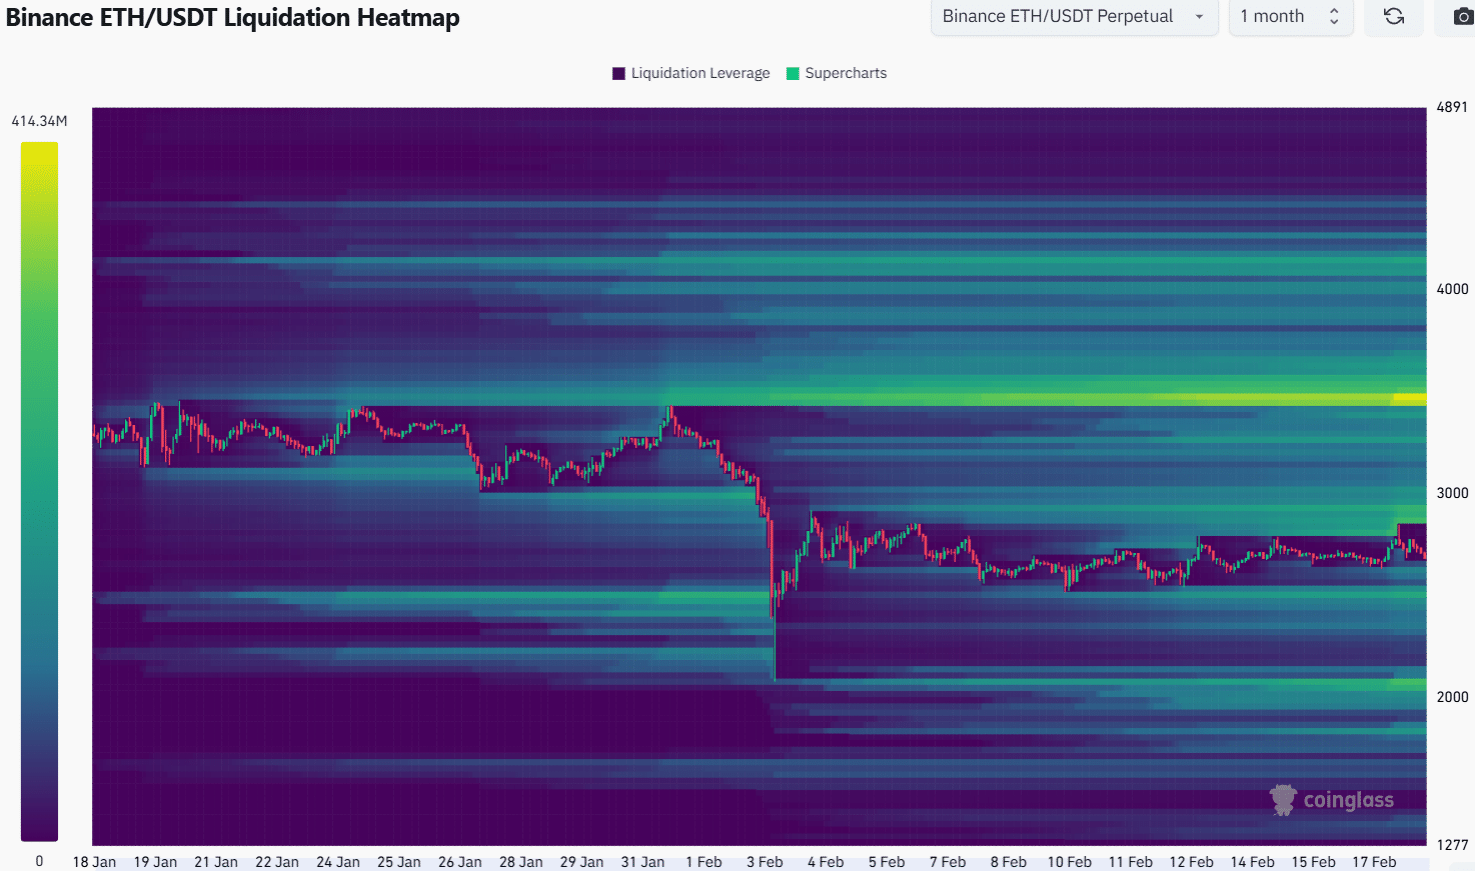
Source: Coinglass
The Ethereum liquidation heatmap of the past month showed that the $2.9k and $2.5k were the closest magnetic zones of noticeable size. The former was closer to the price and would likely pull prices to it soon.
It coincided with the higher timeframe resistance zone at $2,800-$2,850 and the lower timeframe $2,880 resistance. A price move to $2.9k followed by a retracement to $2.5k or $2.6k is anticipated over the coming days.
Disclaimer: The information presented does not constitute financial, investment, trading, or other types of advice and is solely the writer’s opinion