Ethereum [ETH] showed chances of a bounce from this support
The Ethereum 4-hour chart showed that the market structure was strongly bearish. A session close above $1890 would be required to flip the structure.
![Ethereum [ETH] showed chances of a bounce from this support](https://ambcrypto.com/wp-content/uploads/2023/04/PP-1-ETH-cover-1-e1682494313182.jpeg)
Disclaimer: The information presented does not constitute financial, investment, trading, or other types of advice and is solely the writer’s opinion.
- The 4-hour structure and lack of demand showed further losses were likely for ETH.
- Bears can watch out for opportunities in the event of a sharp rejection from resistance.
From 16 April to 25 April, Ethereum posted losses of 15.8%. The bulls managed to hold on to the $2000 support zone briefly, but prices took a tumble when Bitcoin also faced rejection at $30k.
Read Ethereum’s [ETH] Price Prediction 2023-24
Santiment data showed that the massive Ethereum inflows into exchange addresses coincided with ETH dropping below the $2080 level. In the past few hours, another large wave of inflow was spotted. Can traders expect the same outcome?
A deviation below the support zone was followed by a move toward $1900 but bulls aren’t wholly chipper
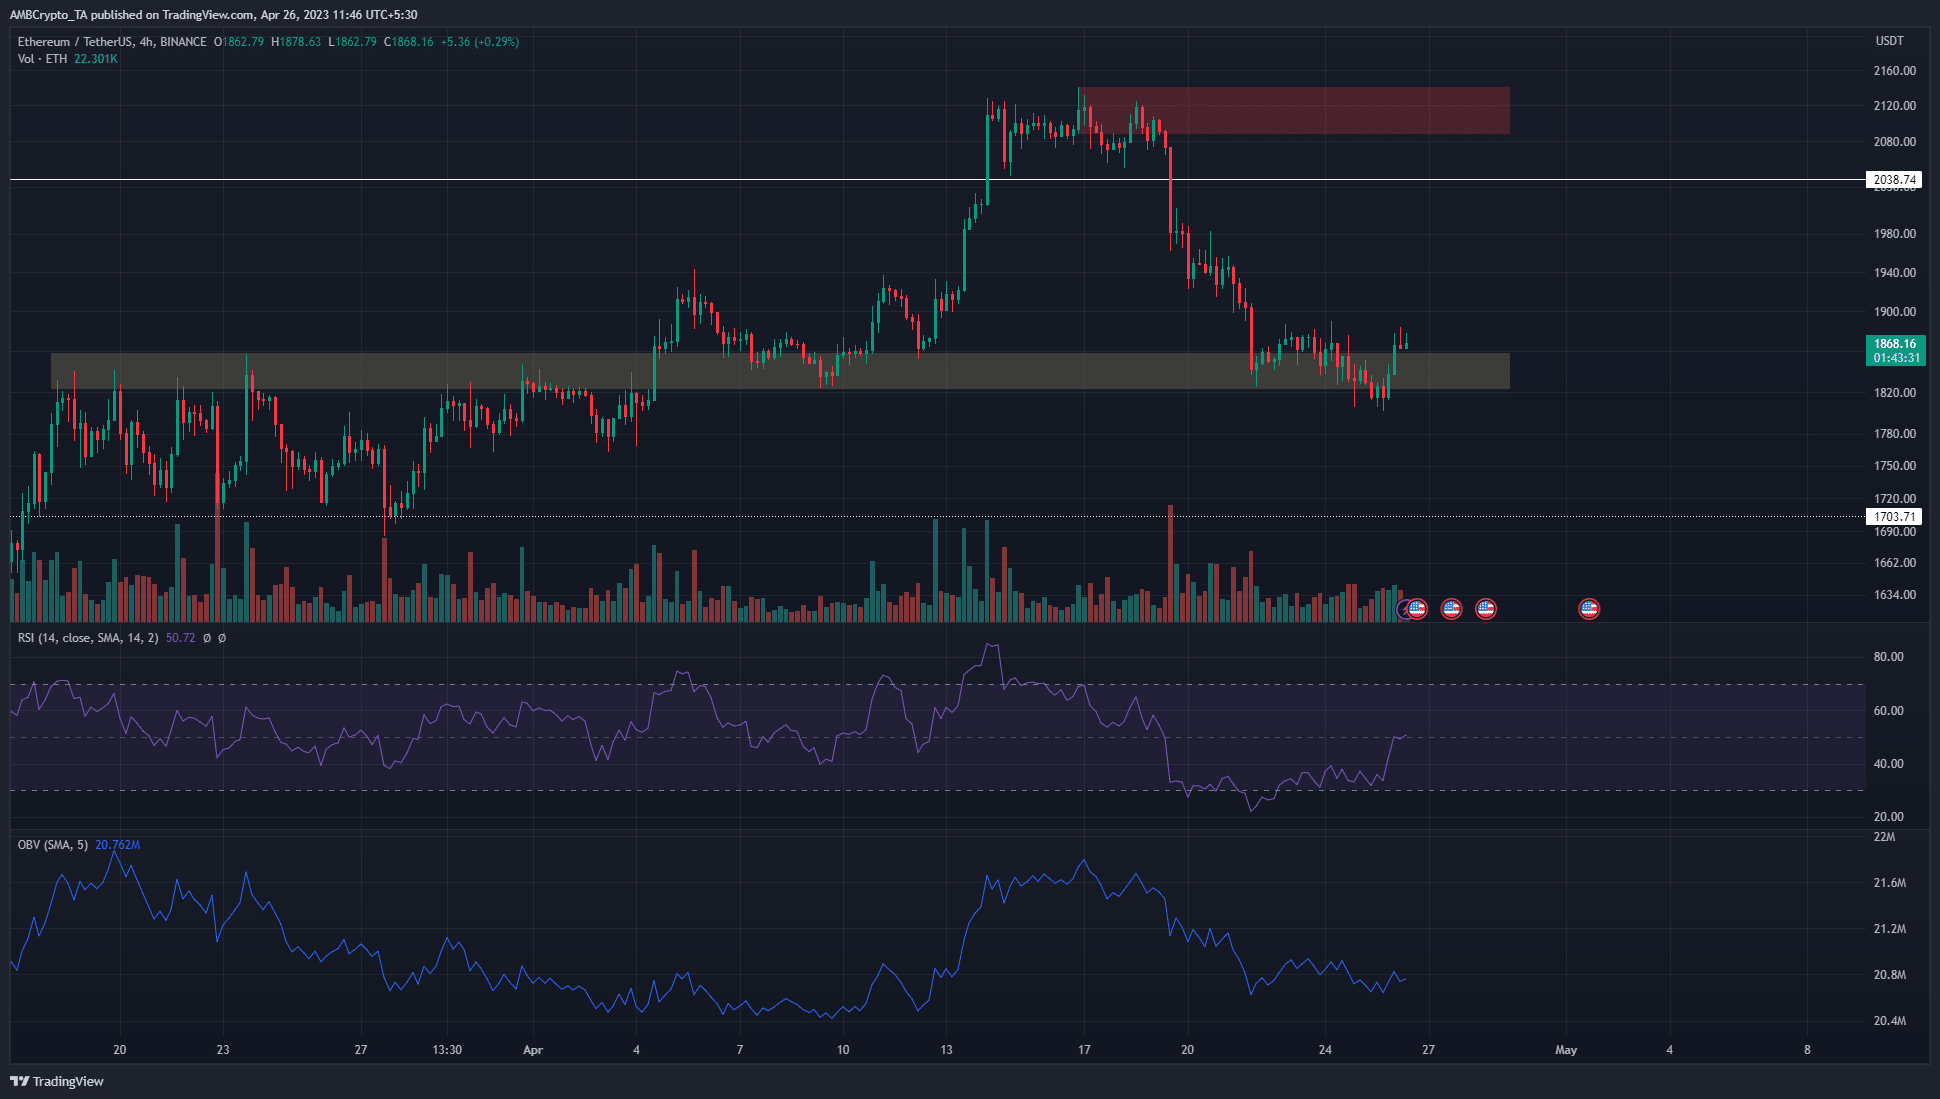
The 4-hour chart showed that the market structure was strongly bearish. A session close above $1890 would be required to flip the structure. A zone of support from earlier in April was highlighted by the yellow box.
This region had acted as a strong resistance to ETH in March.
As things stood, ETH bulls had managed to fight the bears back at least temporarily. However, the OBV continued to move in a downtrend.
Moreover, the RSI was at neutral 50 but was forming a hidden bearish divergence with the price. This suggested a continued downtrend was possible.
Is your portfolio green? Check the Ethereum Profit Calculator
If Ethereum bulls can force a bounce, the $1925 and $2040 levels are resistances to watch out for. The trading volume in the past couple of days was average for the past 20 days, which suggested this bounce was likely not fueled by genuine demand.
This idea was supported by the OBV as well. Therefore, the move below $1820 on 25 April might be indicative of market sentiment rather than being a liquidity hunt.
The exchange inflow data for the past week suggested more selling was imminent
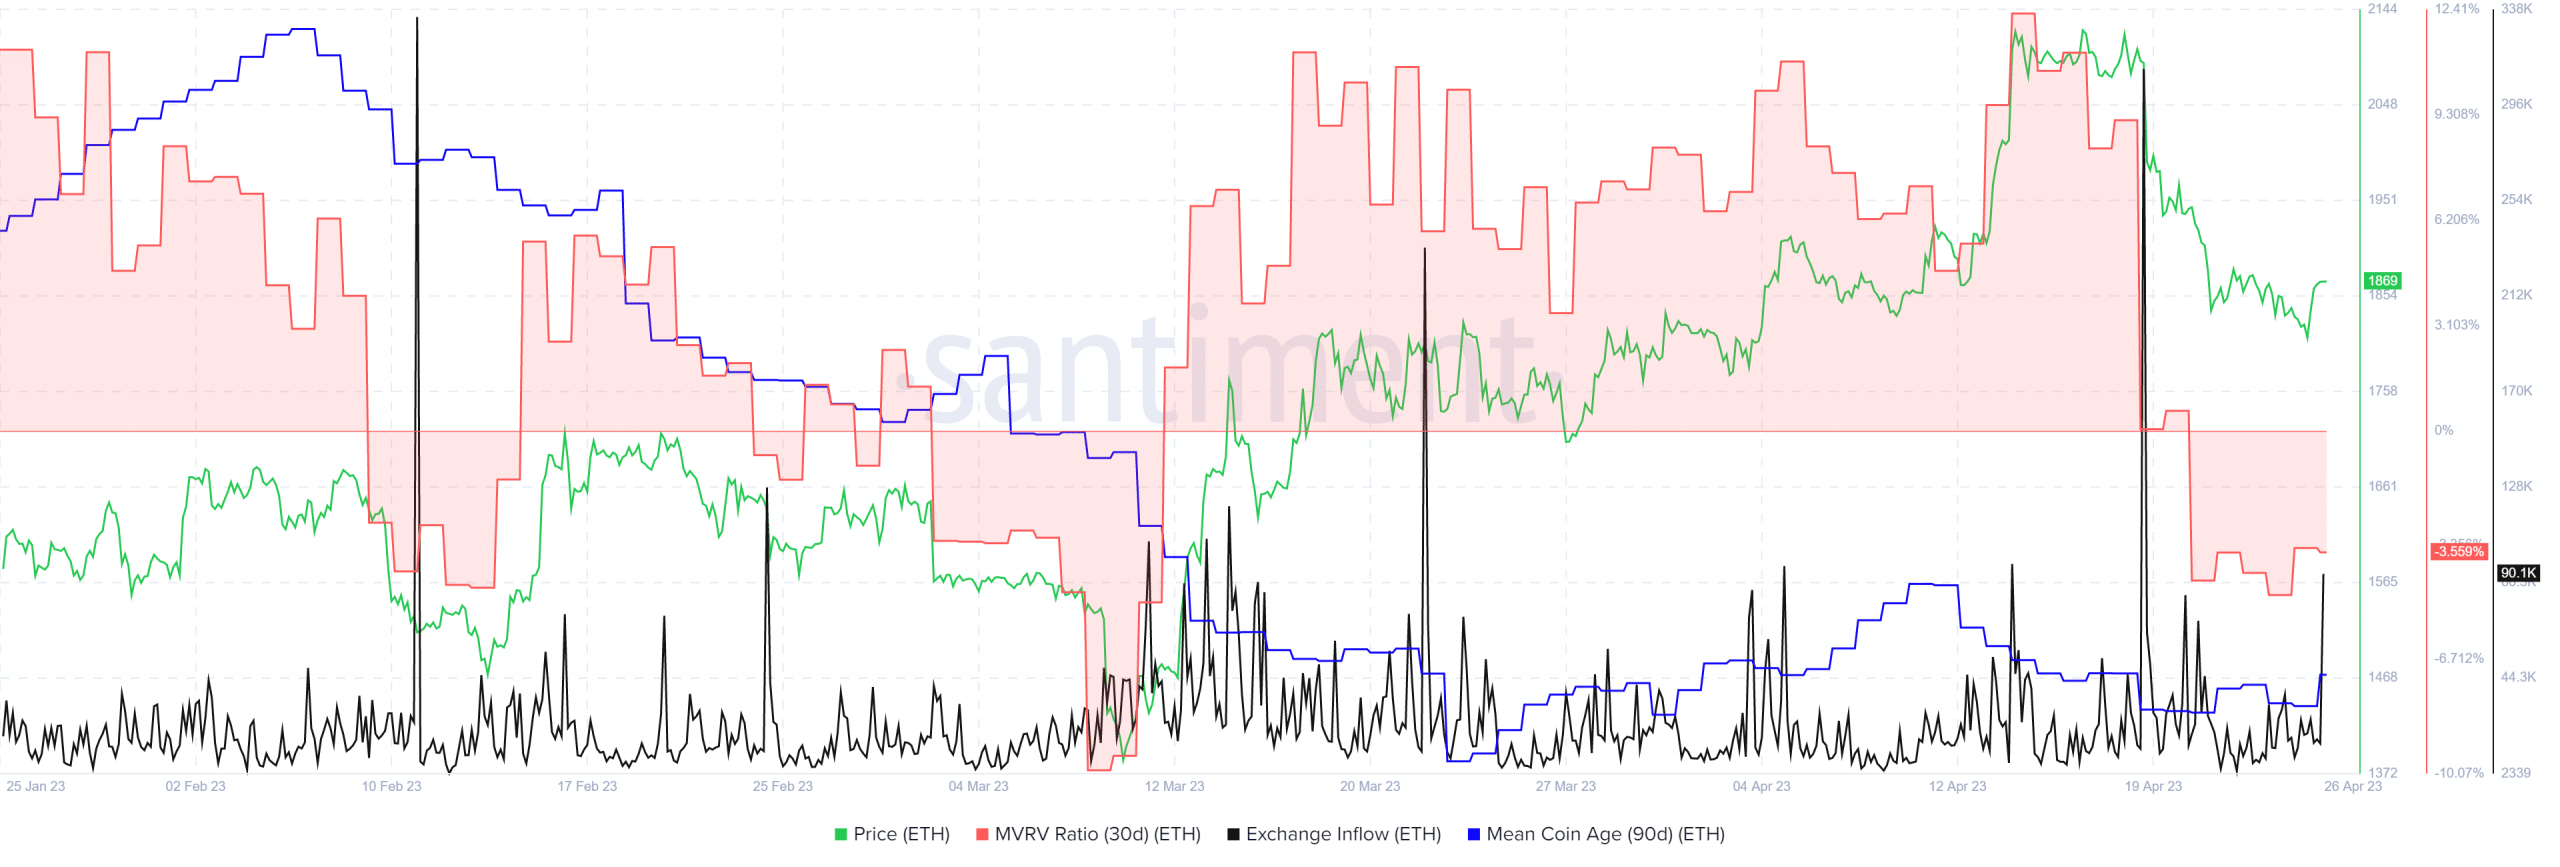
The 30-day MVRV ratio dropped from a 3-month high in mid-April to negative values at press time. This was in the wake of intense selling pressure over the past two weeks, which saw ETH drop from $2125 to $1820.
The MVRV values suggested people who were short-term ETH holders were at a loss. Another wave of profit-taking might not occur. Yet, the mean coin age has been flat over the past week and began to climb slightly higher in recent days.
Moreover, 90,220 ETH inflows were seen on 26 April, hours before press time. It was another factor that pointed toward continued selling pressure in the market.