
- Ethereum seemed to have a bearish market structure on multiple timeframes
- Bears have not slowed down their selling, and ETH could fall towards $1.6k next
Ethereum [ETH] has fallen by 11.8% over the past week, with technical analysis revealing that market bears have not weakened. In fact, ETH whale transfers to exchanges underlined the bearish market sentiment.
At the time of writing, ETH bulls were swimming against the tide, and the prospect of further losses was growing more likely.
Ethereum sinks below early March support
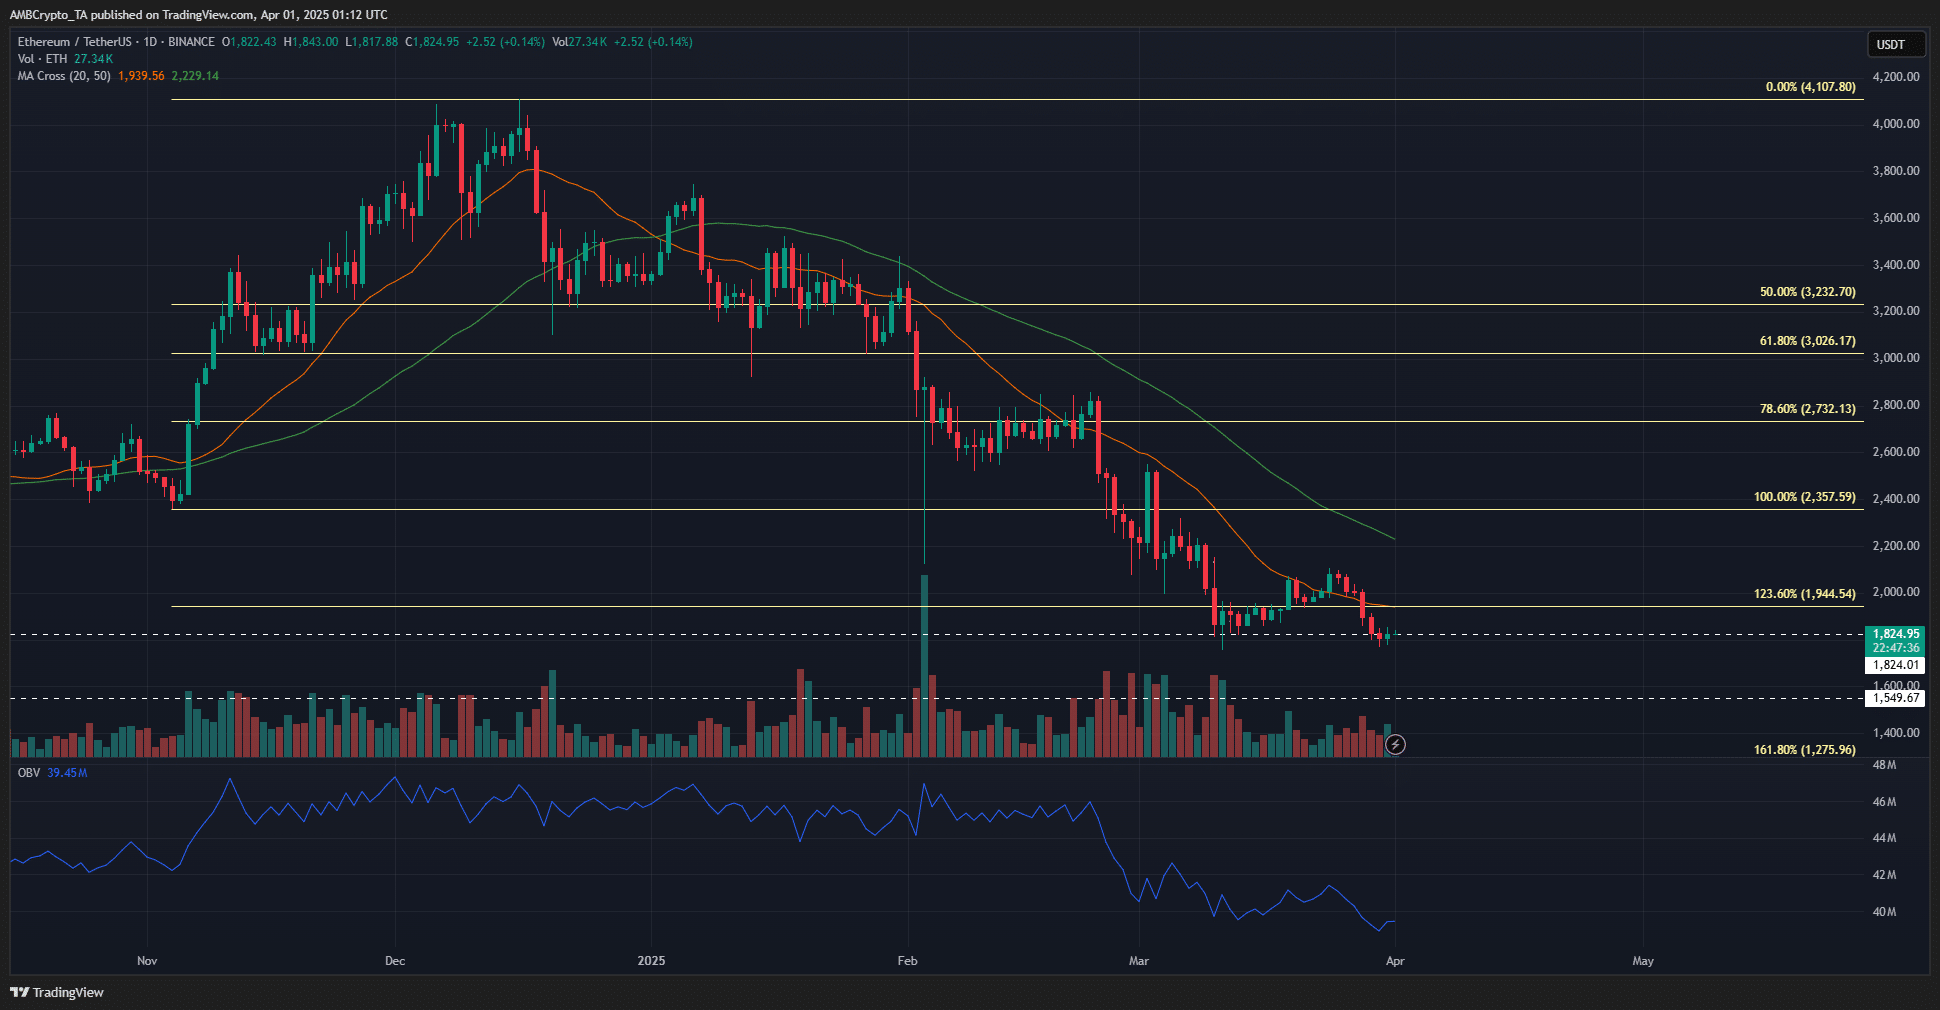
Source: ETH/USDT on TradingView
Ethereum had a strongly bearish outlook on the 1-day timeframe. It was again below the 20-day moving average and has been for most of 2025. The moving averages showed the bearish momentum did not slow down either.
Neither did the selling pressure ease as ETH fell below the $2,000-psychological level. The OBV made lower highs and lower lows and made a new lower low on 30 March. This signified a downtrend in progress on the OBV, and steady selling pressure on Ethereum.
The $1,824 and $1,550 support levels from October-November 2023 would be the next price targets for ETH. Since it closed a 1-day trading session below $1,824, the bears would likely have control of the region.
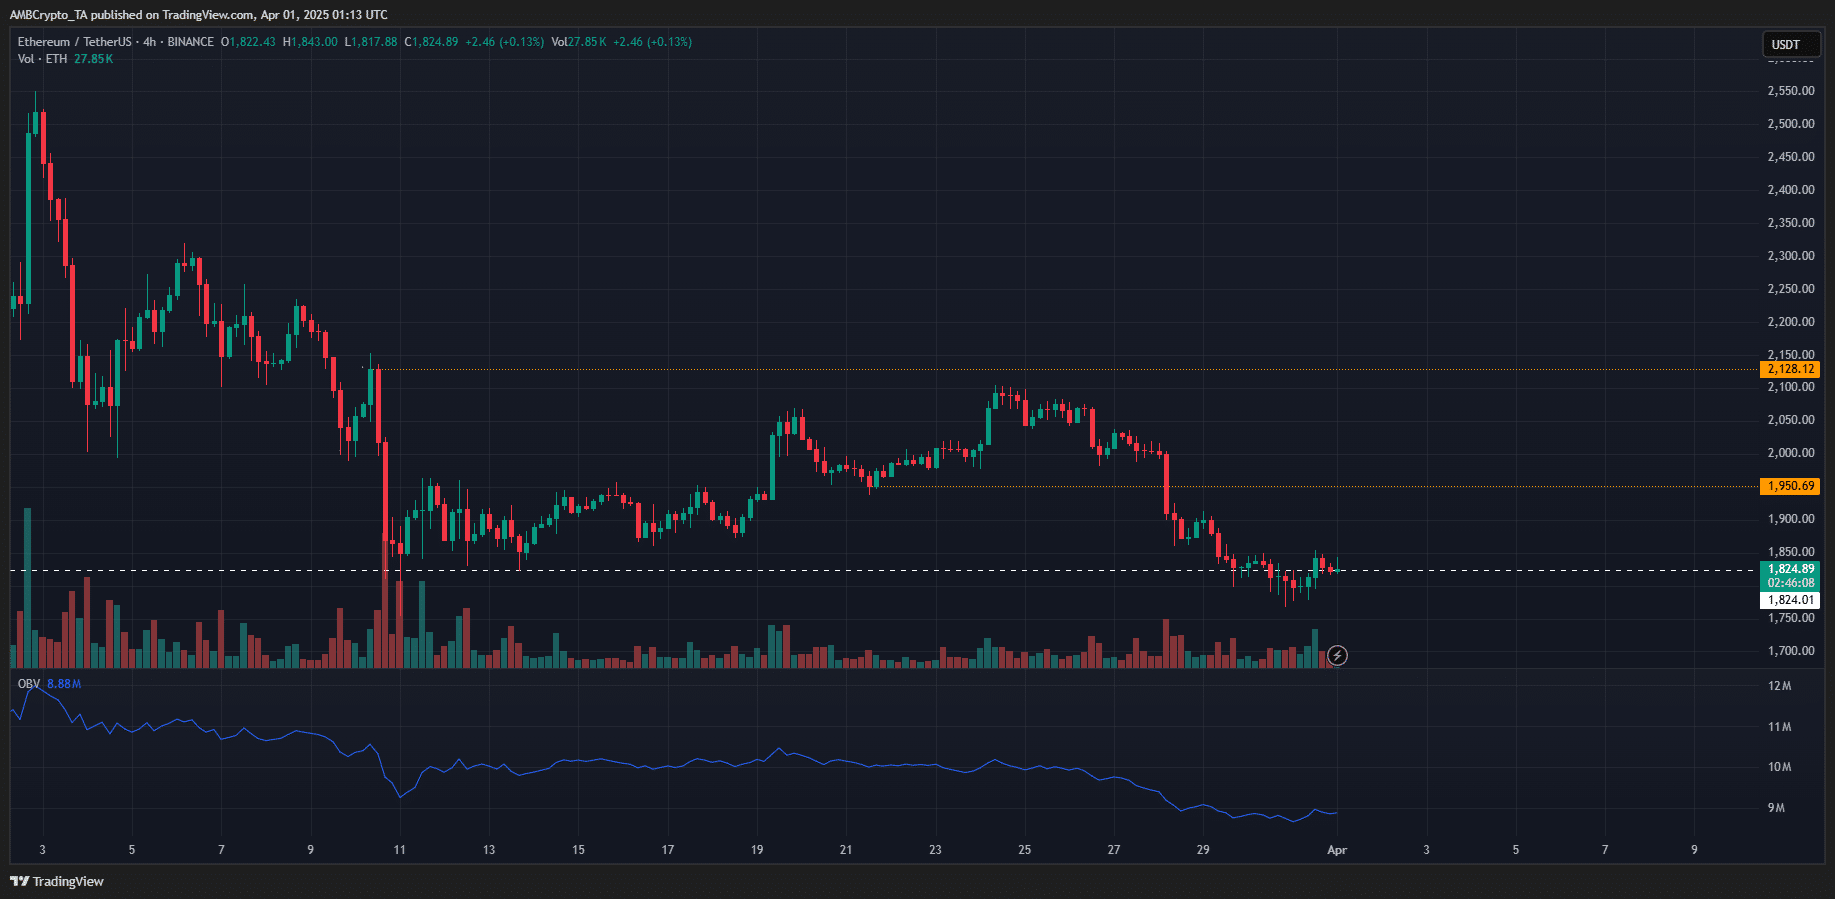
Source: ETH/USDT on TradingView
The 4-hour chart showed that the $1,850 zone, which served as support in mid-March, is now acting as resistance. The market structure seemed to be bearish too. The rally towards $2,128 did not meet its target, but reversed at $2,100. The $1,950 higher low was not defended either.
The OBV, like it did on the 1-day chart, continued its steady downtrend. Hence, the price action on the daily and the 4-hour charts pointed to further losses for the leading altcoin.
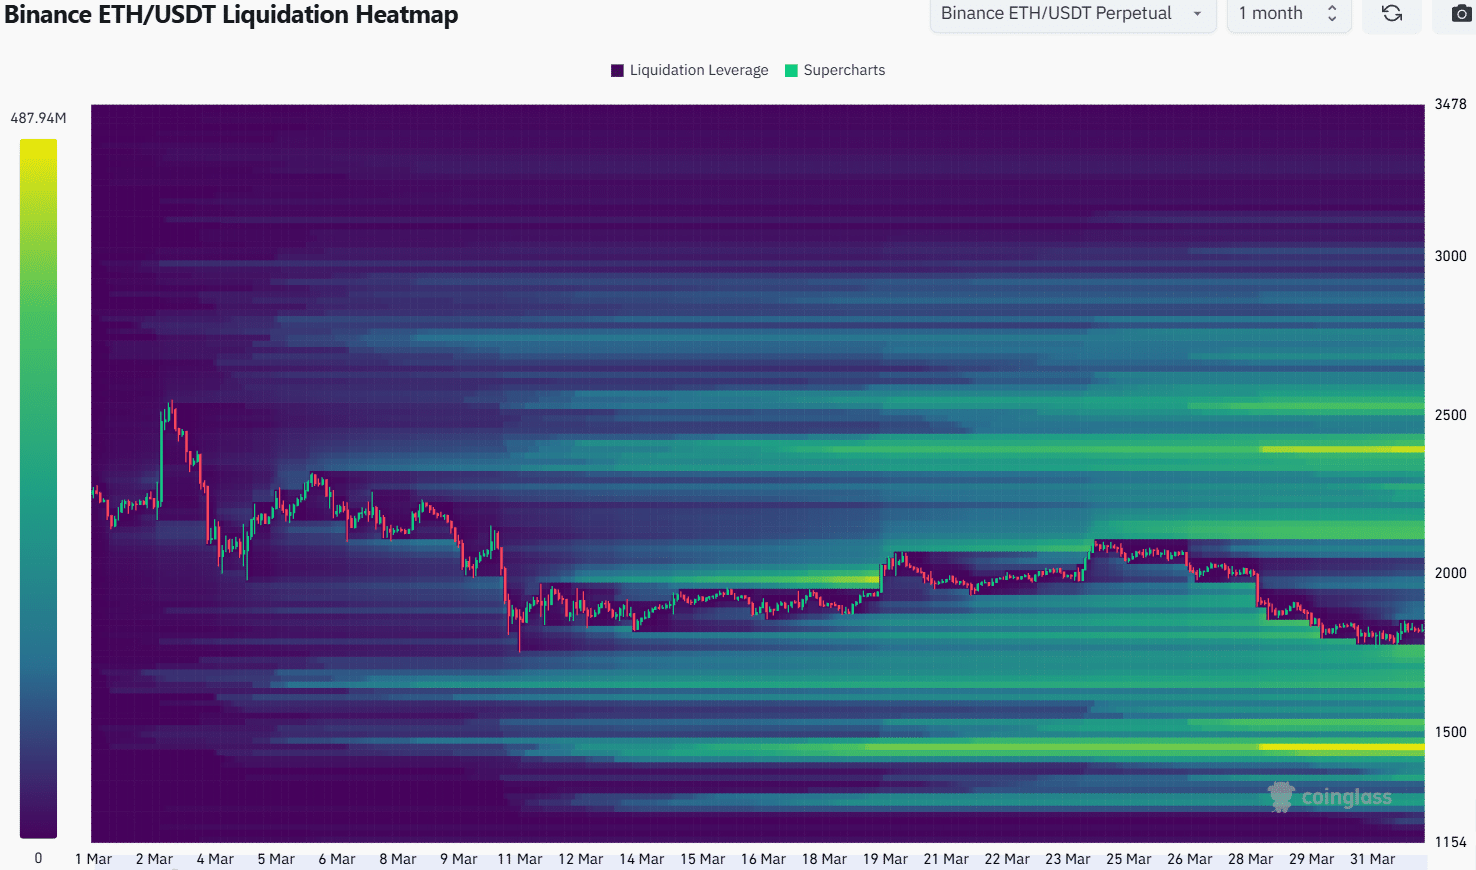
Source: Coinglass
The liquidation heatmap outlined $2,150 as a magnetic zone that could pull prices higher. At the same time, the $1,760-$1,640 area emerged as a liquidity pocket much closer to the price. This meant Ethereum is likely to fall lower towards $1.6k in the coming days.
Given the price action and the market sentiment, more losses may be likely in the short-term. The long-term downtrend has not been halted either.
Disclaimer: The information presented does not constitute financial, investment, trading, or other types of advice and is solely the writer’s opinion