
- Ethereum’s $2,800 surge triggered short liquidations, contrasting with Bitcoin’s stagnant price
- Geopolitical factors and ETF inflows contributed to the growing divergence between Ethereum and Bitcoin
Ethereum’s [ETH] recent surge toward $2,800 has sparked significant attention in the crypto markets, with traders rushing to liquidate short positions.
However, despite Ethereum’s rally, Bitcoin has failed to mirror this momentum, adding volatility to the market.
As a result, a new $2,600 liquidation pool has formed, heightening the unpredictability of the current price action.
ETH’s price surge: Short position liquidations and key levels
ETH’s price surged to nearly $2,800, sparking significant liquidations of short positions. Short interest increased over 40% in a week and more than 500% since November 2024, indicating strong bearish sentiment among traders.
If ETH fails to sustain its upward movement, the $2,600 level will likely serve as a key support zone.
This could lead to further liquidations and consolidation. The high short interest may amplify selling pressure if the price revisits this level.
Ethereum: Divergence with Bitcoin
While ETH surged, Bitcoin’s price remained stagnant, highlighting a divergence between the two assets.
Geopolitical factors, such as the Trump administration’s tariffs, have driven investors toward Bitcoin, perceived as a safe-haven asset.
Ethereum, with its broader use cases, is seen as more vulnerable to regulatory scrutiny. Furthermore, Bitcoin ETFs have seen over $40 billion in institutional investments, compared to Ethereum’s lower inflows.
This has contributed to Bitcoin’s increasing dominance and Ethereum’s shrinking market share.
The aggregated liquidations heatmap
The ETH aggregated liquidations heatmap reveals significant liquidation clusters near $2,800, aligning with Ethereum’s recent surge.
Short positions were quickly liquidated as the price moved upward. On the downside, the $2,600 liquidation pool remains a critical support area to watch.
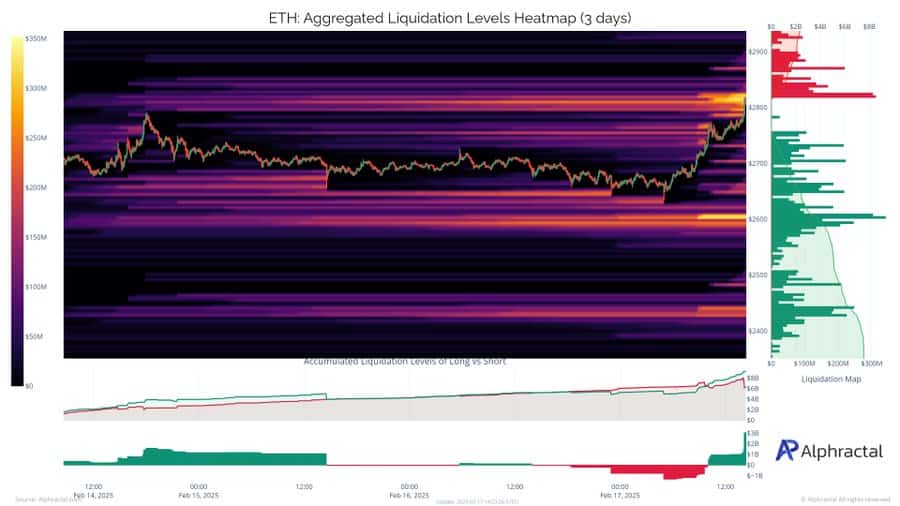
Source: Alphractal
Key technical indicators signal caution
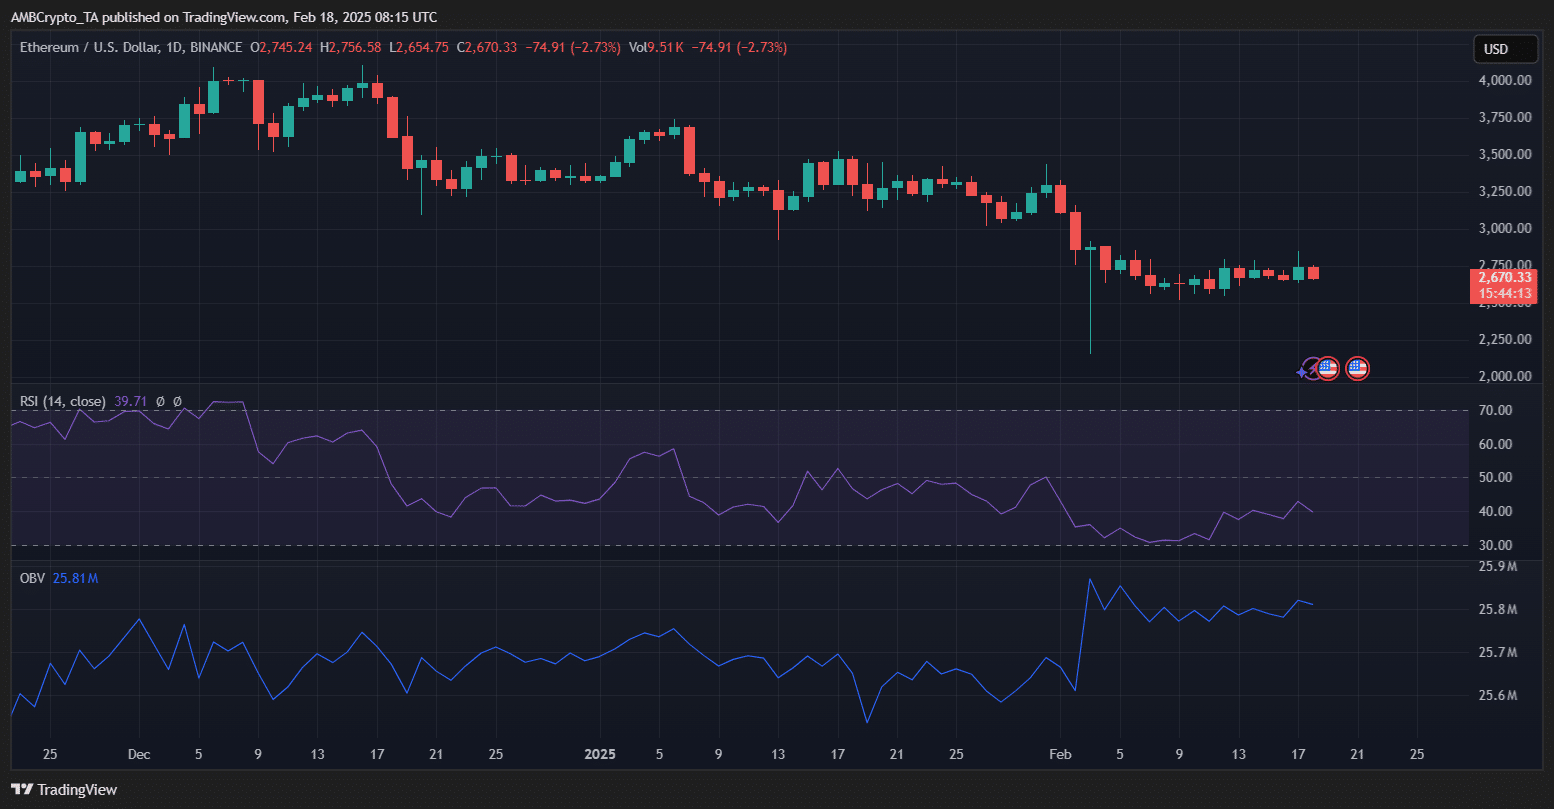
Source: TradingView
Ethereum’s daily price chart shows a bearish bias, with ETH trading at $2,670, after a 2.73% drop, at press time. The RSI stood at 39.71, signaling potential buying interest if the trend persists.
However, the OBV at 25.81 million suggested limited buying momentum, leaving selling pressure in control.
The coin’s consolidation around $2,670 reflects market indecision. A break below this level could bring ETH to test the $2,600 liquidation pool, while a rebound would require a strong volume breach of the $2,800 resistance.