Ethereum – How ‘strong’ sellers could limit ETH’s upside on the charts
Metrics showed that there was a chance of a deeper Ethereum price drop towards $2.1k.

- Ethereum’s consolidation around $2.6k in February offered some hope for recovery
- On-chain metrics revealed that the altcoin’s sellers aren’t exhausted yet
The Bybit hack saw $1.46 billion worth of Ethereum [ETH] siphoned out of a cold wallet. The exchange saw an unprecedented amount of withdrawals, but it has been able to process them smoothly. At the time of writing, ETH was down 2.64% in the last 24 hours.
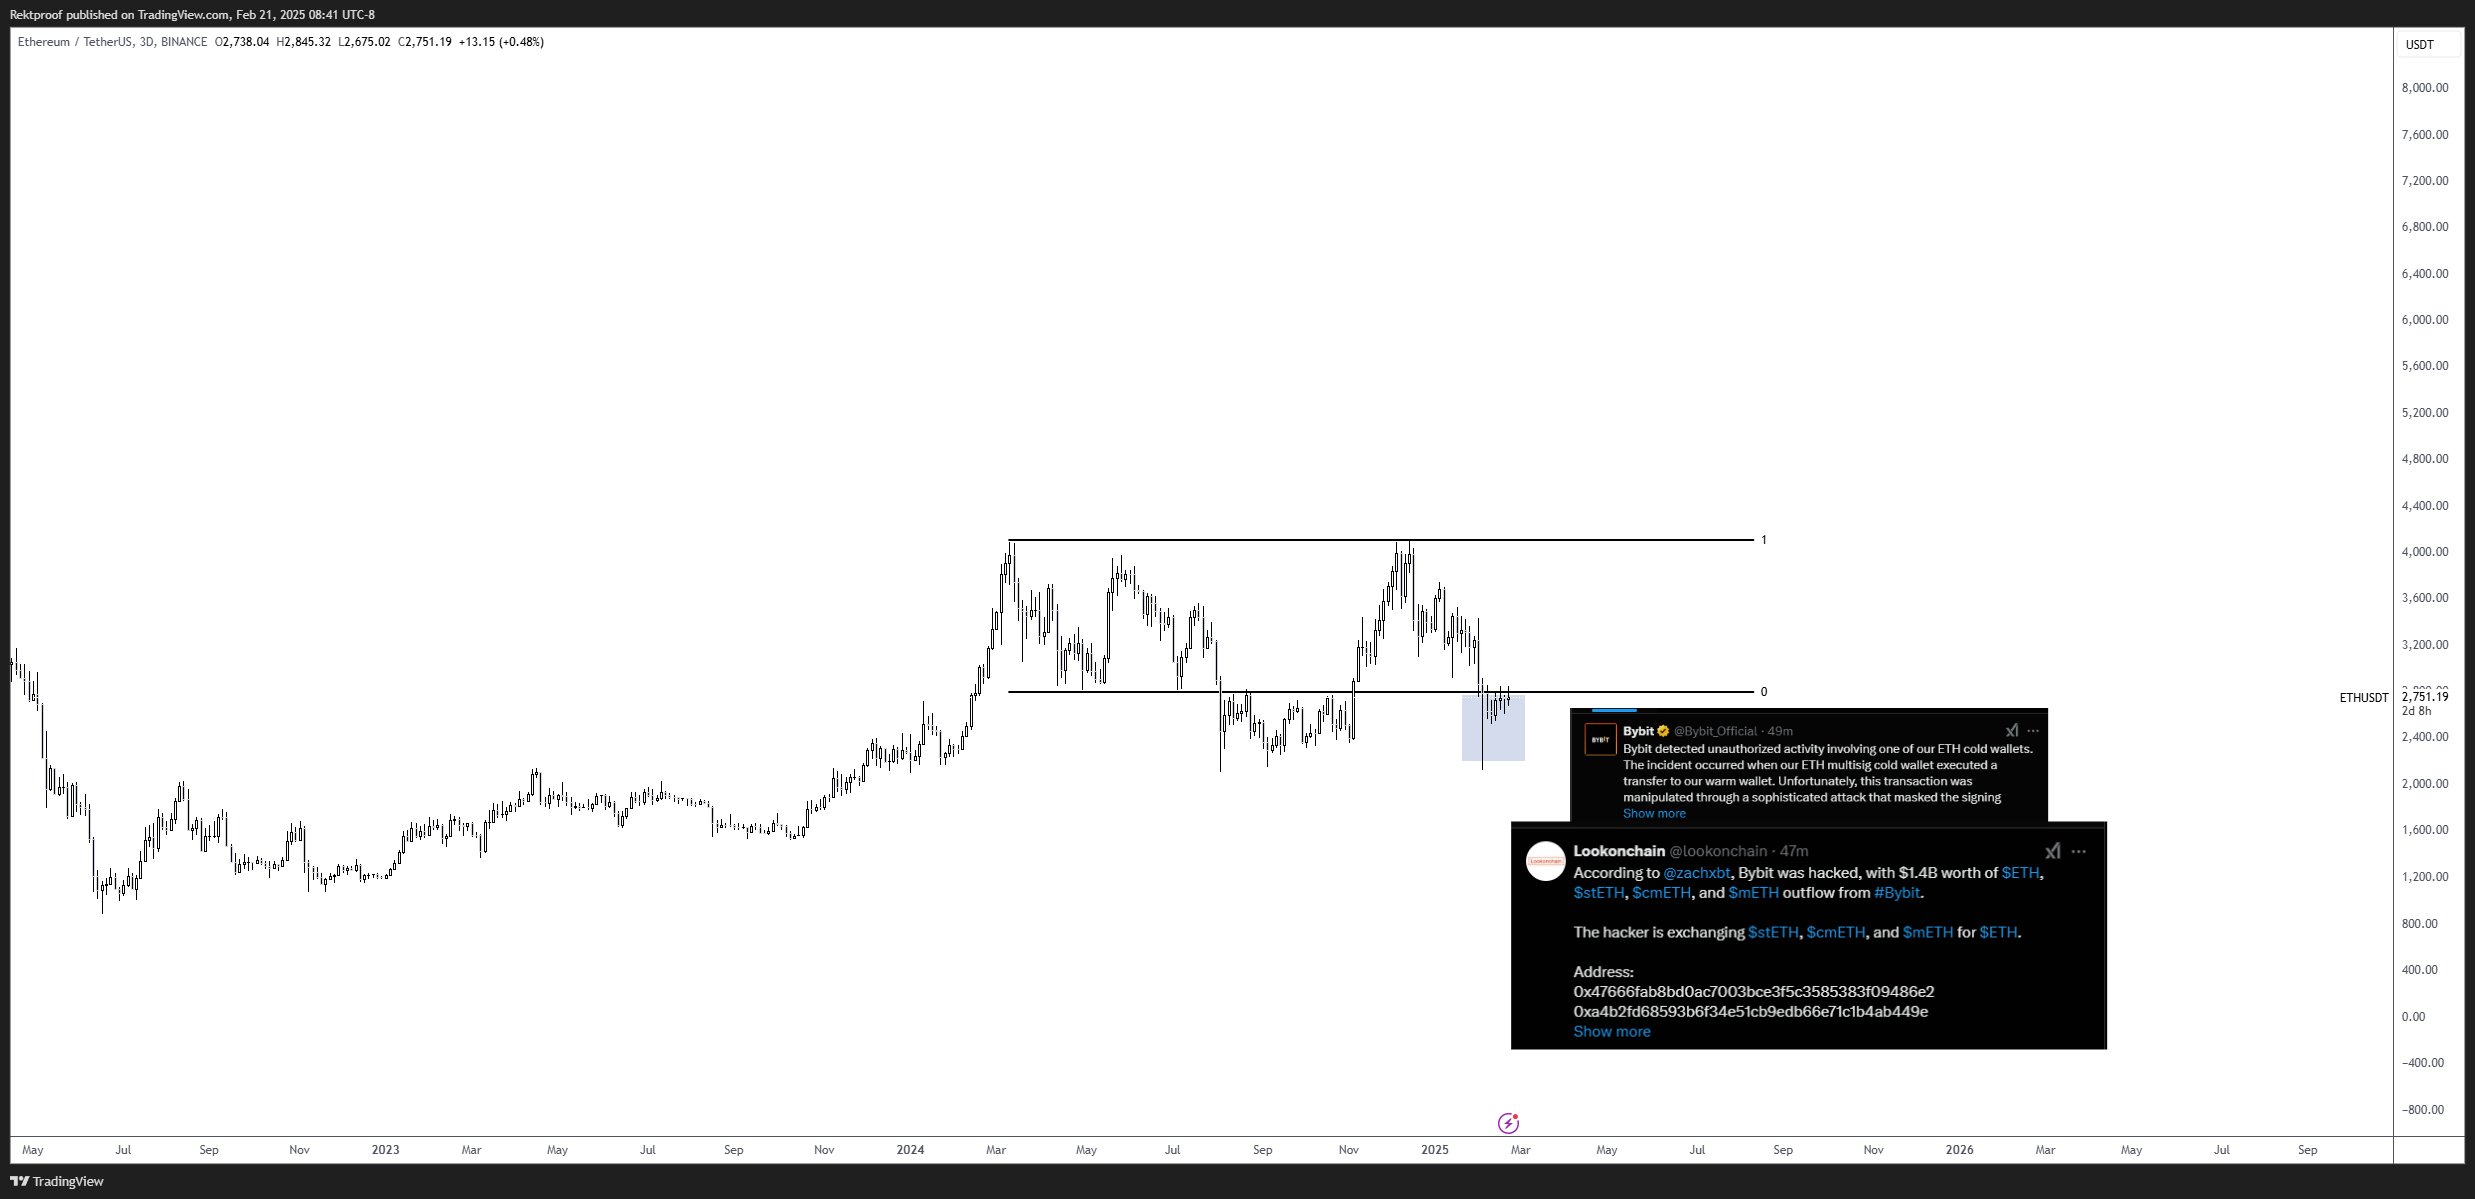
Crypto analyst RektProof noted a pattern emerging in a post on X. The range formation from Q1 2024 seemed to be still in play, and the recent events provided a deviation below the lows. This is also a place where accumulation occurred from July-October 2024, before the swift rally in November.
A comparison with Bitcoin [BTC] making cycle lows on the back of black swan events such as COVID or the FTX crash was also made. This implied that ETH might also be making such lows. However, is this too good to be true?
Metrics showed that Ethereum has room to go lower
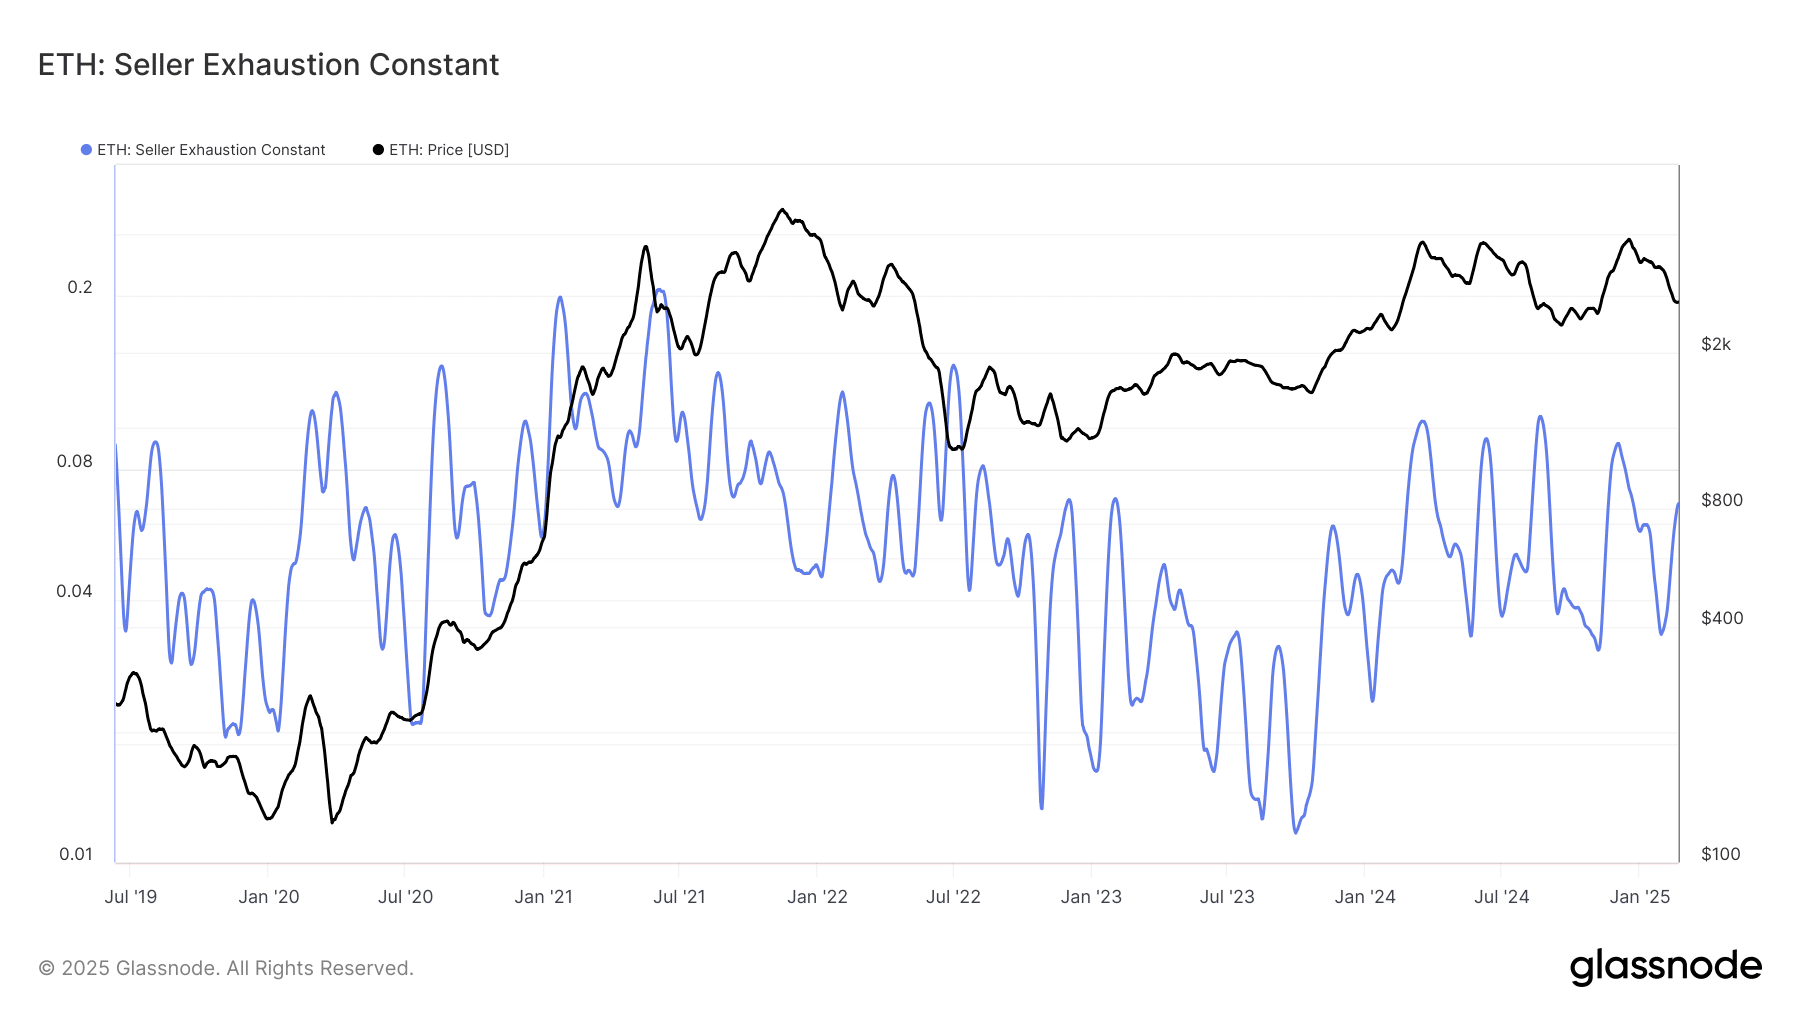
The seller exhaustion metric is a product of the percentage supply in profit and the 30-day price volatility. In recent weeks, the volatility has been high, while the percent supply in profit has been falling.
This explained the rise in the exhaustion metric. It is used to mark low-risk price bottoms when a sizeable chunk of the supply is not in profit and the price is under consolidation. The prevailing market conditions do not reflect that though, at least not on the higher timeframes.
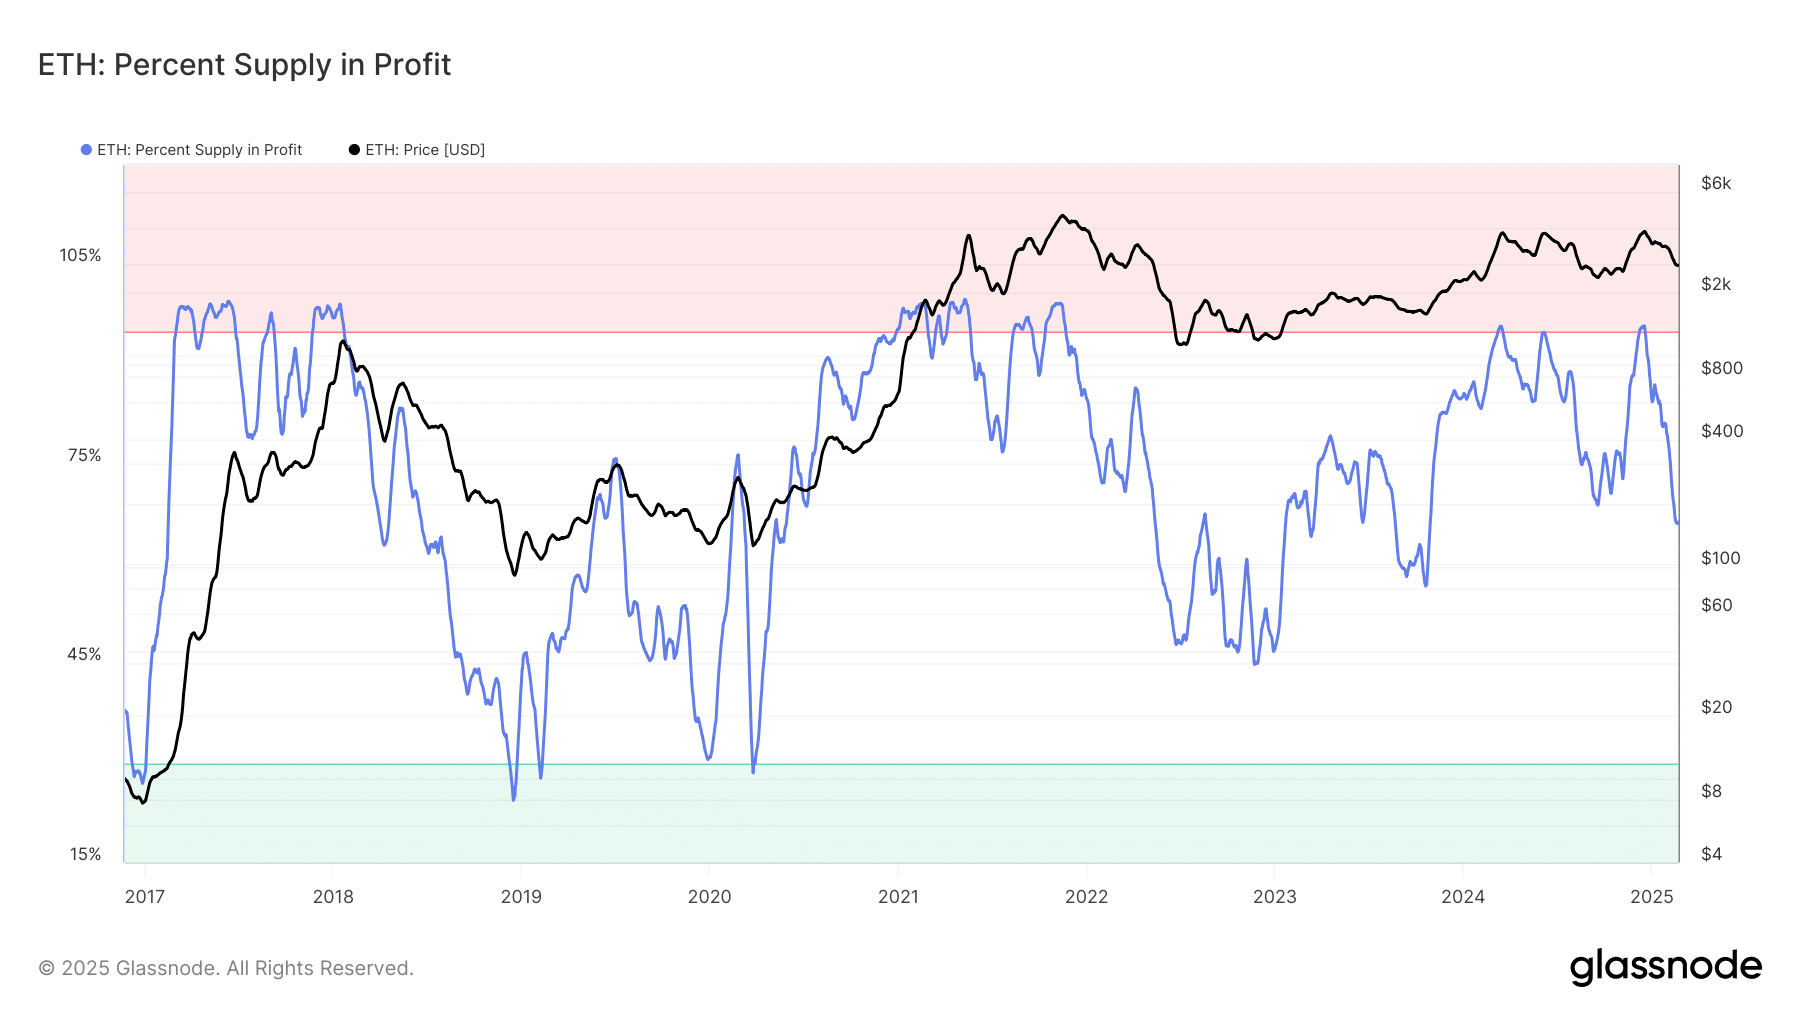
The percentage supply in profit has been falling since the price faced rejection from $4k in December.
At press time, the metric was lower than at any point since October 2023. Its weak performance while Bitcoin traded near $100k has been a source of frustration for holders.
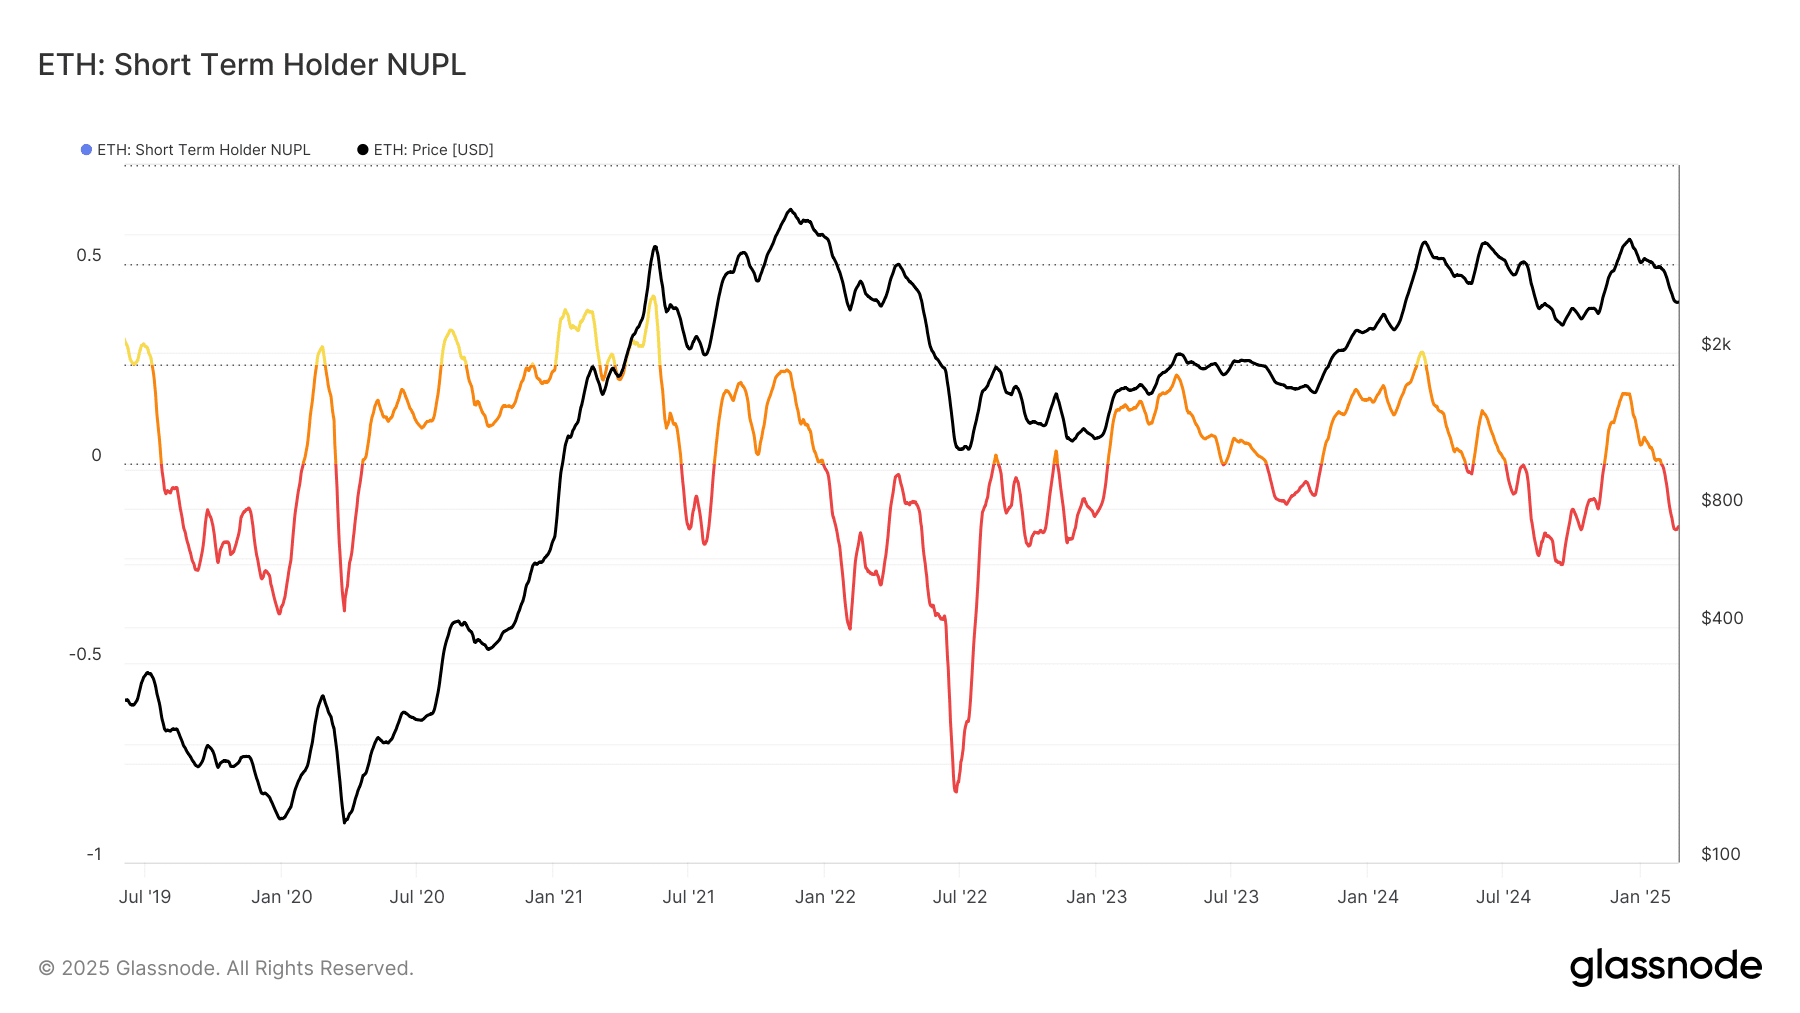
The short-term holder (STH) net unrealized profit/loss (NUPL) takes into account transactions younger than 155 days. Values below 0 indicate that STHs are at a loss and at press time, the metric was at -0.164.
Combined with the range formation highlighted earlier, it appeared that this could be a good buying opportunity for ETH. And yet, the NUPL being negative does not automatically mark local bottoms.
For example, in January 2022, the STH NUPL was at -0.018, falling to -0.4 in February. After a few weeks of price consolidation around the $3k-level, Ethereum plunged to $1.1k in June 2022 – Driving the NUPL deeper.
While this was an extreme case, it revealed that the metrics need to be used contextually. Combining the price action with the metrics examined so far, we can see that there is a chance of ETH’s price dropping towards $2.1k.