Ethereum: How these levels can shape ETH’s path to recovery

Disclaimer: The findings of the following analysis are the sole opinions of the writer and should not be considered investment advice.
- Ethereum’s recent decline below the near-term EMAs highlighted an increased selling edge.
- The altcoin noted a gradual decline in its funding rates over the past day.
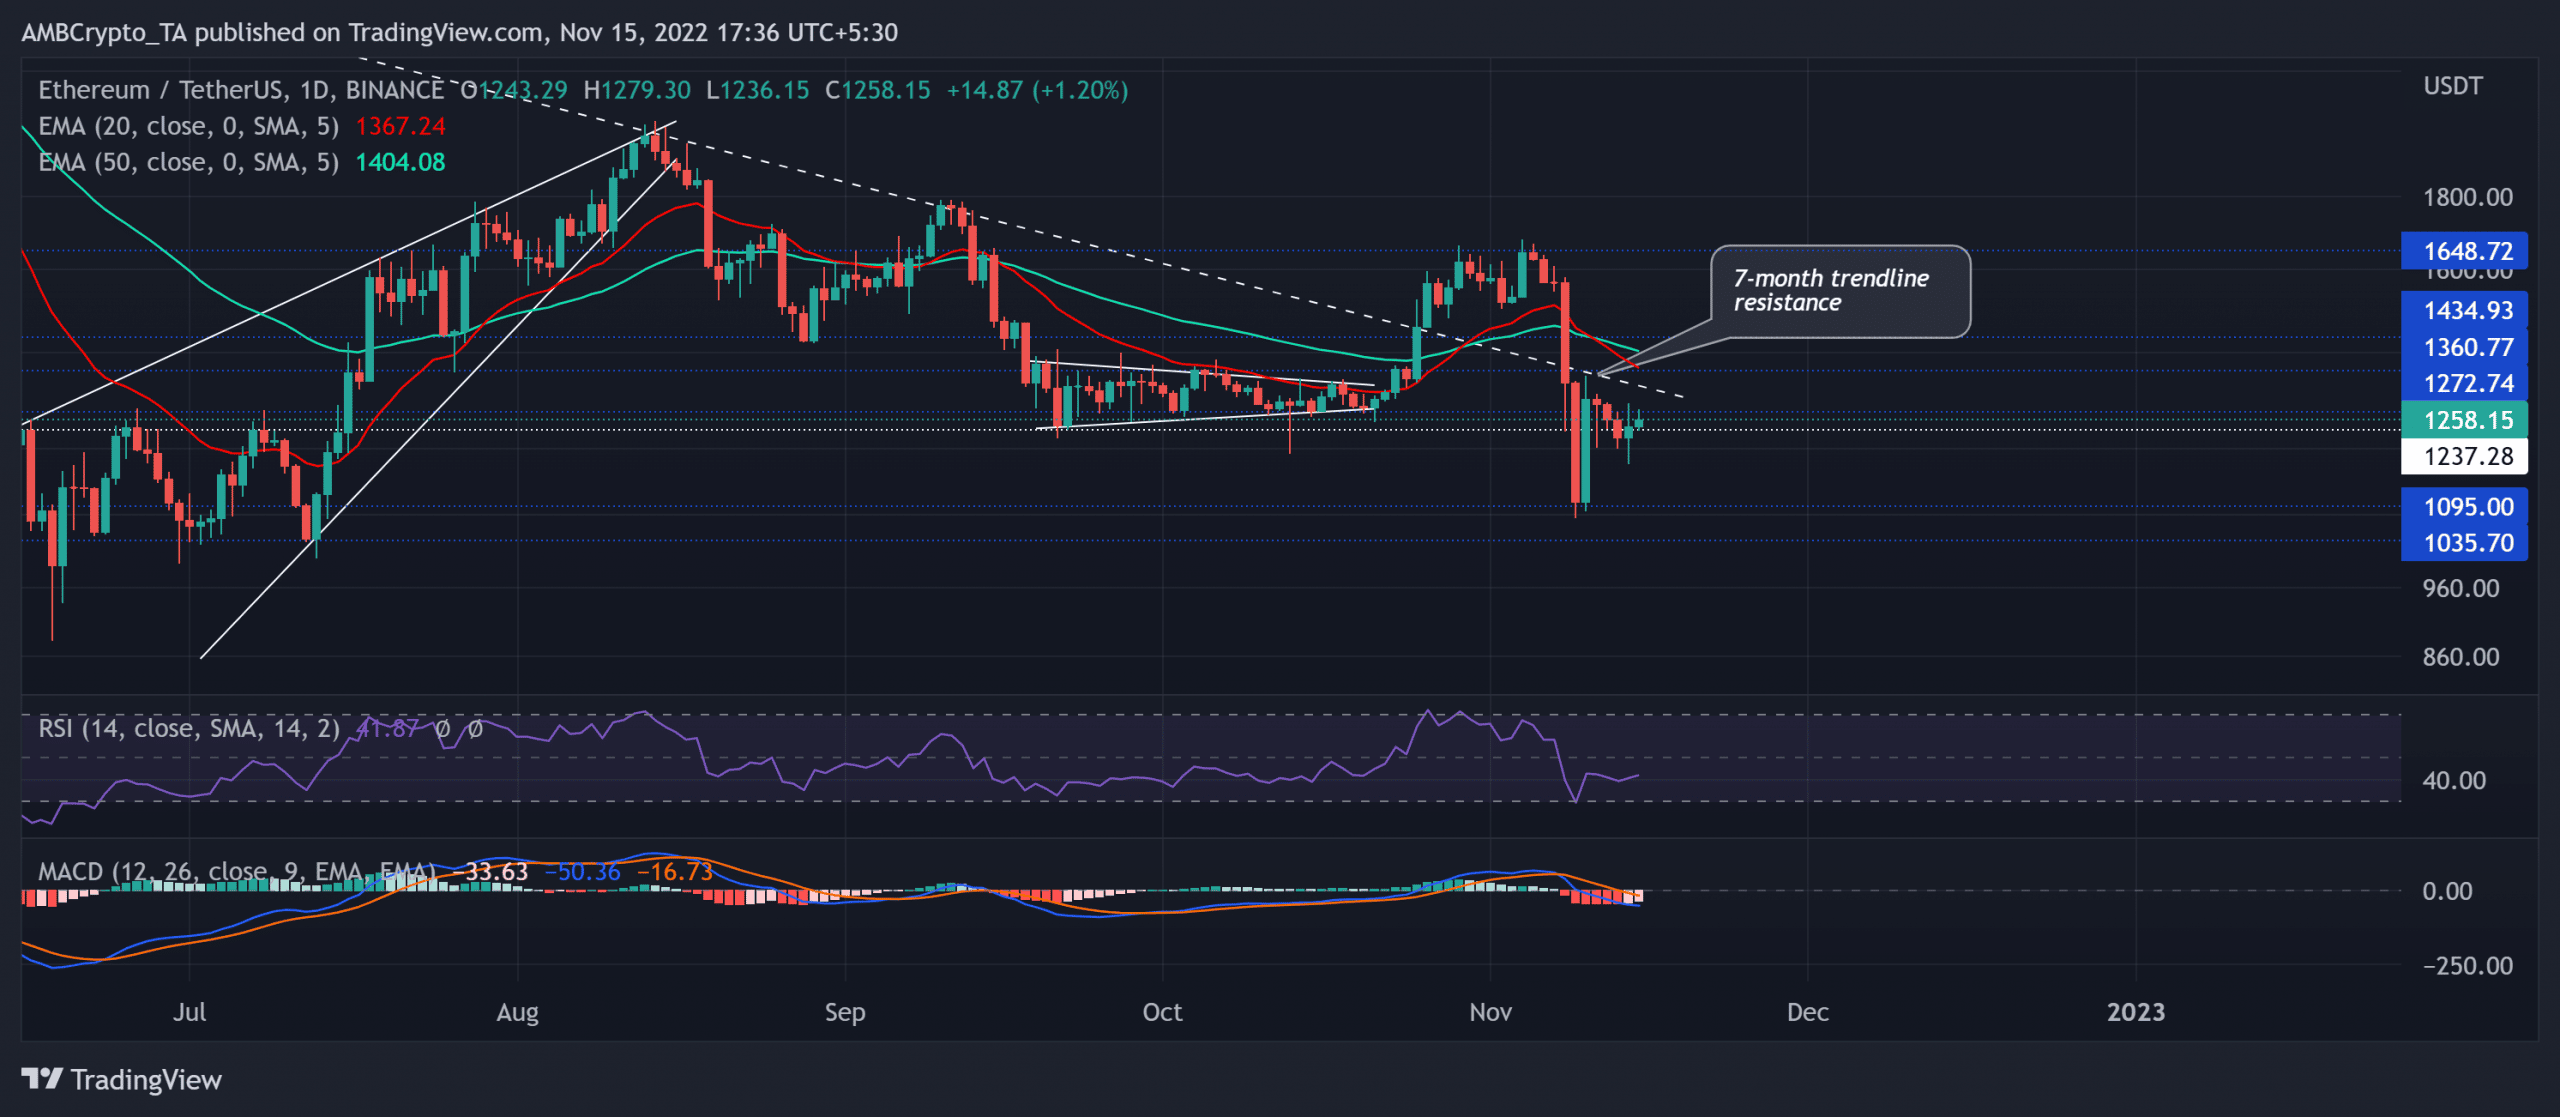
Ethereum [ETH] witnessed double-digit losses over the last few days after flipping one-eighty from the $1,648 resistance. The entailing pulldown below the trendline resistance (white, dashed) positioned the king alt to an extended downside.
Read Ethereum’s Price Prediction 2023-24
Should the recent rebound from its immediate support continue, ETH could hope to challenge the confluence of resistances in the $1,300 zone. At press time, the alt was trading at $1,258.15.
Will the sellers continue pressing for more?
Historically, ETH bears consistently demonstrated their intentions to inflict a pullback from the trendline resistance for over seven months.
Moreover, the $1,648 ceiling undermined the recent jump above this trendline by reigniting the bearish pressure. As a result, ETH glided south below the limitations of its 20 EMA (red) and the 50 EMA (cyan).
The recent price movements chalked out a bearish pennant-like structure in the daily timeframe. Furthermore, should the trendline resistance and 20 EMA continue to pose hurdles, ETH could see a break below its immediate support. In such a case, the $1,095 region could continue supporting rebounds.
On the other hand, an immediate rebound above the trendline resistance and the near-term EMAs would affirm a bearish invalidation. For this, the buyers must break the bounds of the $1,360 ceiling.
The Relative Strength Index (RSI) reversed from its oversold region to depict ease in selling pressure. But the Moving Average Convergence Divergence (MACD)’s decline below the zero mark hinted at a shift in the broader momentum toward the sellers.
Funding rate analysis
According to data from Coinglass, ETH’s funding rates across all exchanges either stood at the brink of the zero mark or turned negative over the last few hours. The investor sentiment in the futures market wobbled at press time while the markets strived to recover. ETH buyers could look for a plausible reversal on this front before placing any calls in the coming days.
Finally, investors/traders must watch out for Bitcoin’s [BTC] movement. This is because ETH shared a 90% 30-day correlation with the king coin.


