Ethereum, IOTA, Uniswap Price Analysis: 04 June

A strong rally awaited Ethereum in case of a breakout from $2,910-3,150. IOTA eyed a hike towards $2.24 if the 50% Fibonacci level ($1.67) is breached. Finally, Uniswap showed weakness as the price was denied at its 50% Fibonacci level ($29.03).
Ethereum [ETH]
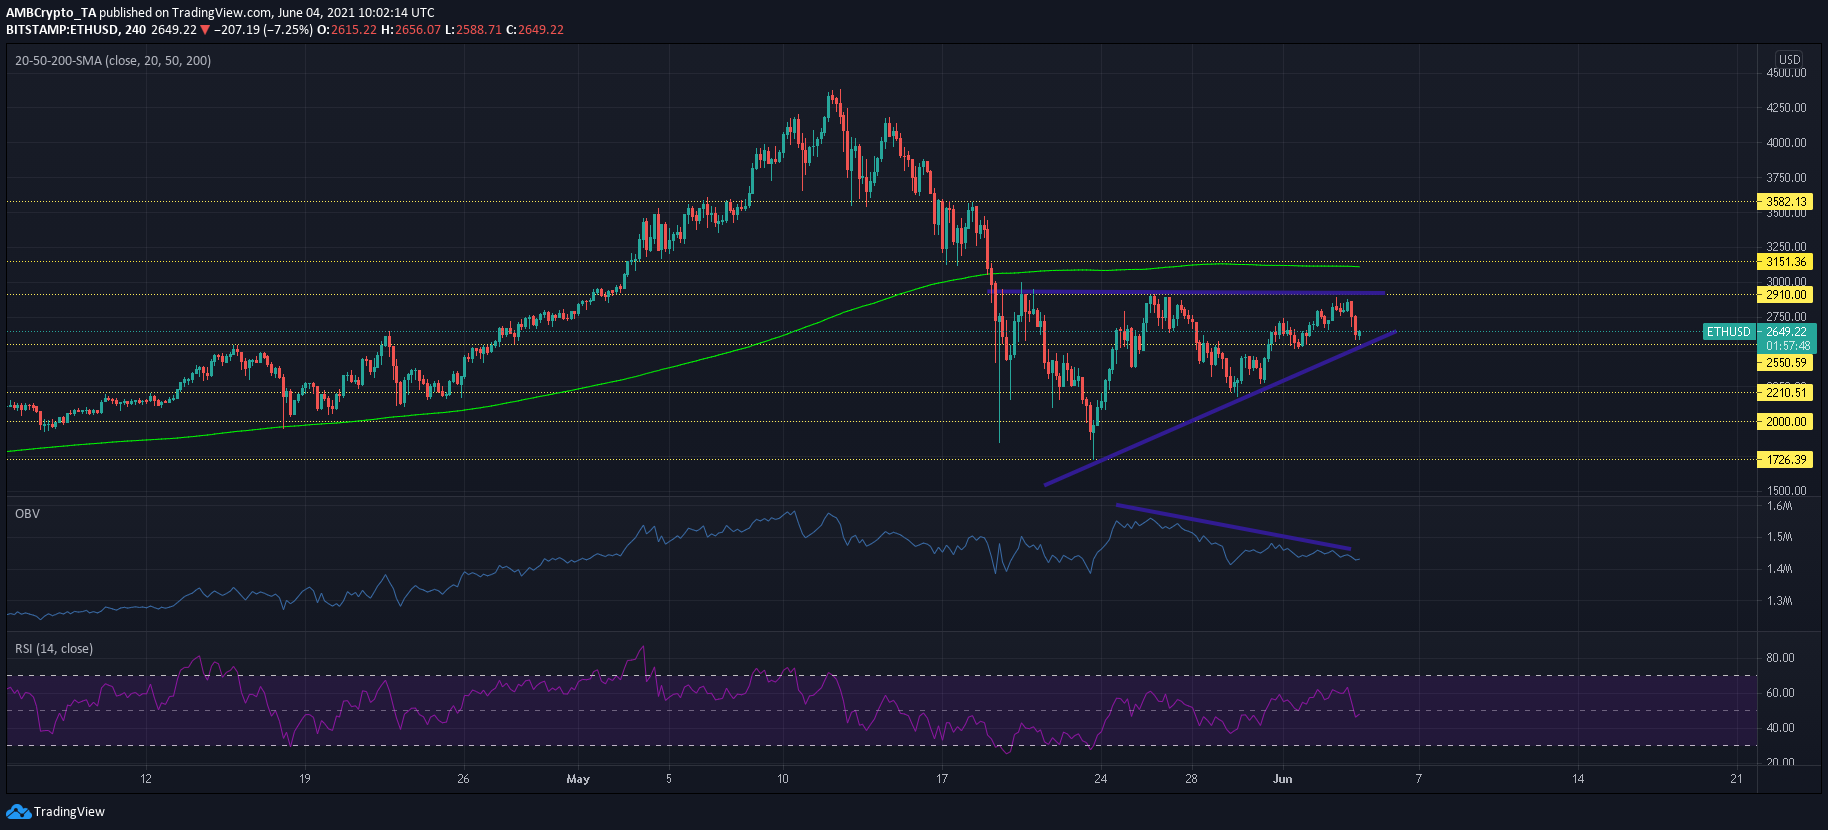
Ethereum’s upper ceiling around $2,910 has been under the spotlight since the 19 May crypto sell-off. Despite multiple attempts, however, the bulls have been unsuccessful in forcing a breakout above this upper ceiling. Alas, the formation of higher lows at $2,160, $2,300, and $2,560 led to the formation of an ascending triangle.
A breakout above $2,900 and $3,151 could trigger a sharp rally for ETH, especially since bullish sentiment would be high after climbing past the 200-SMA (green). For such an outcome, selling pressure would need to evaporate, but the OBV’s downtrend suggested just the opposite. In fact, the indicator also formed a bearish divergence with the price.
Breakouts would be difficult in such a scenario and bulls would do well to maintain ETH above the $2,550-support. Meanwhile, the RSI looked to stabilize around 50 and defending the bottom trendline from a breakdown would heighten chances of a favorable outcome over the coming days.
IOTA
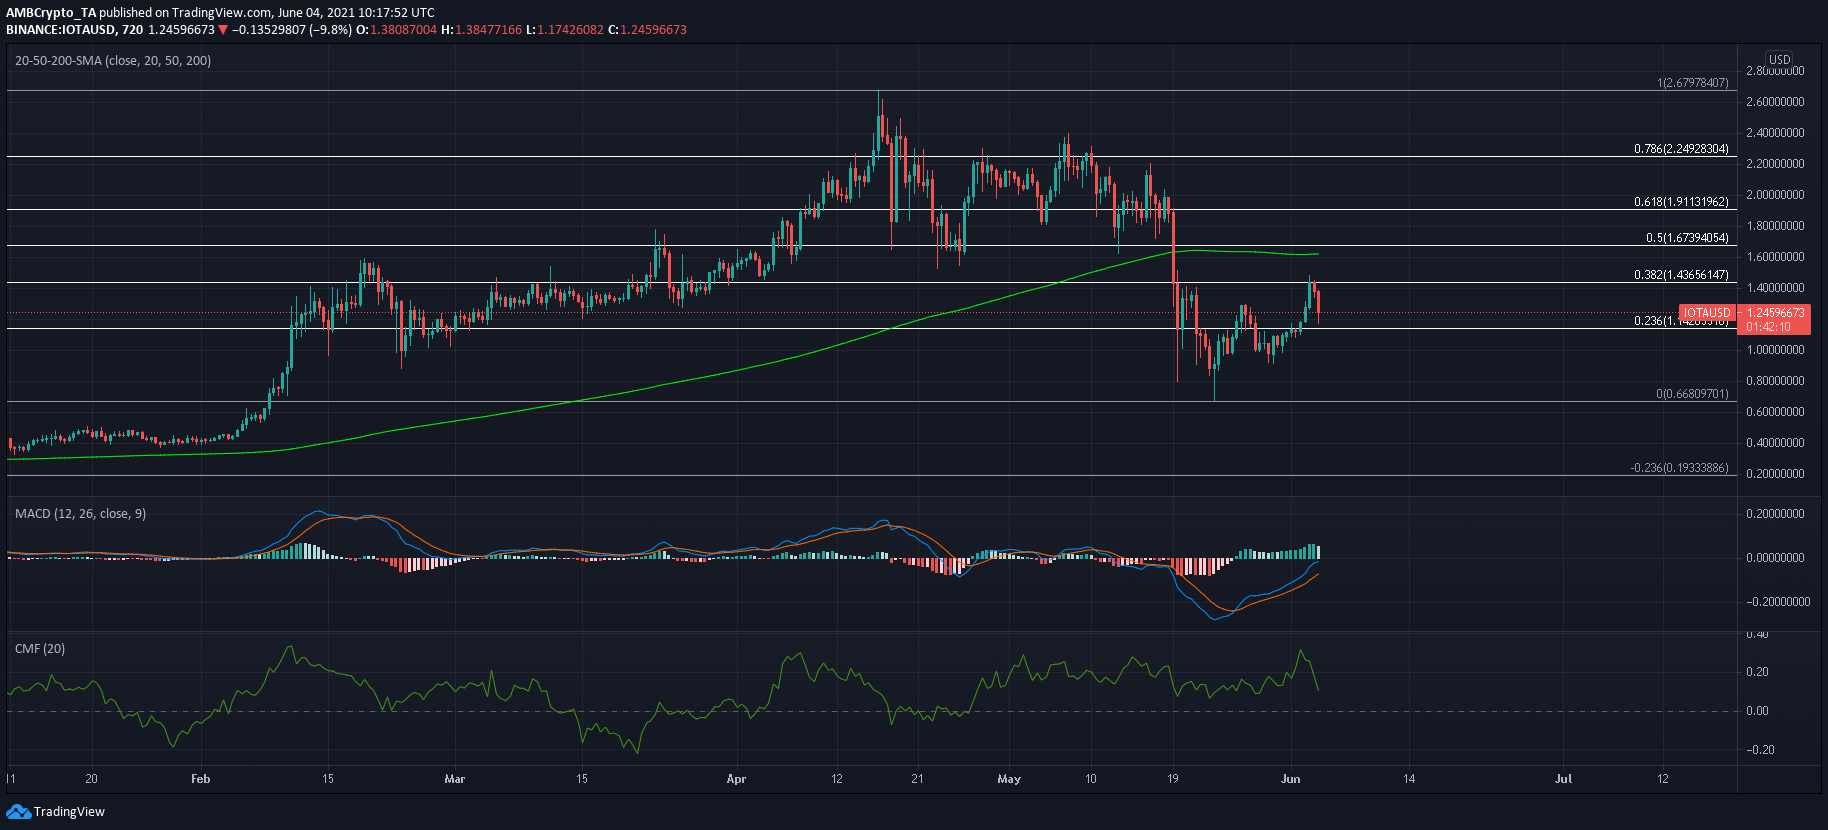
Sellers returned in the IOTA market at the 38.2% Fibonacci level ($1.42) and southbound movement was seen over the last two sessions. The 23.6% level is expected to alleviate incoming losses, but a breakdown could drag IOTA towards the $0.923-support. For the bulls, an important area to reclaim lay above the 50% level ($1.67) and 200-SMA (green). A successful breakout could initiate a rally towards $2.24.
The MACD maintained a northbound trajectory – A sign of recovery from the bearish market. Despite seeing multiple dips, the CMF was trading above the half-line as capital inflows outweighed the outflows.
Uniswap [UNI]
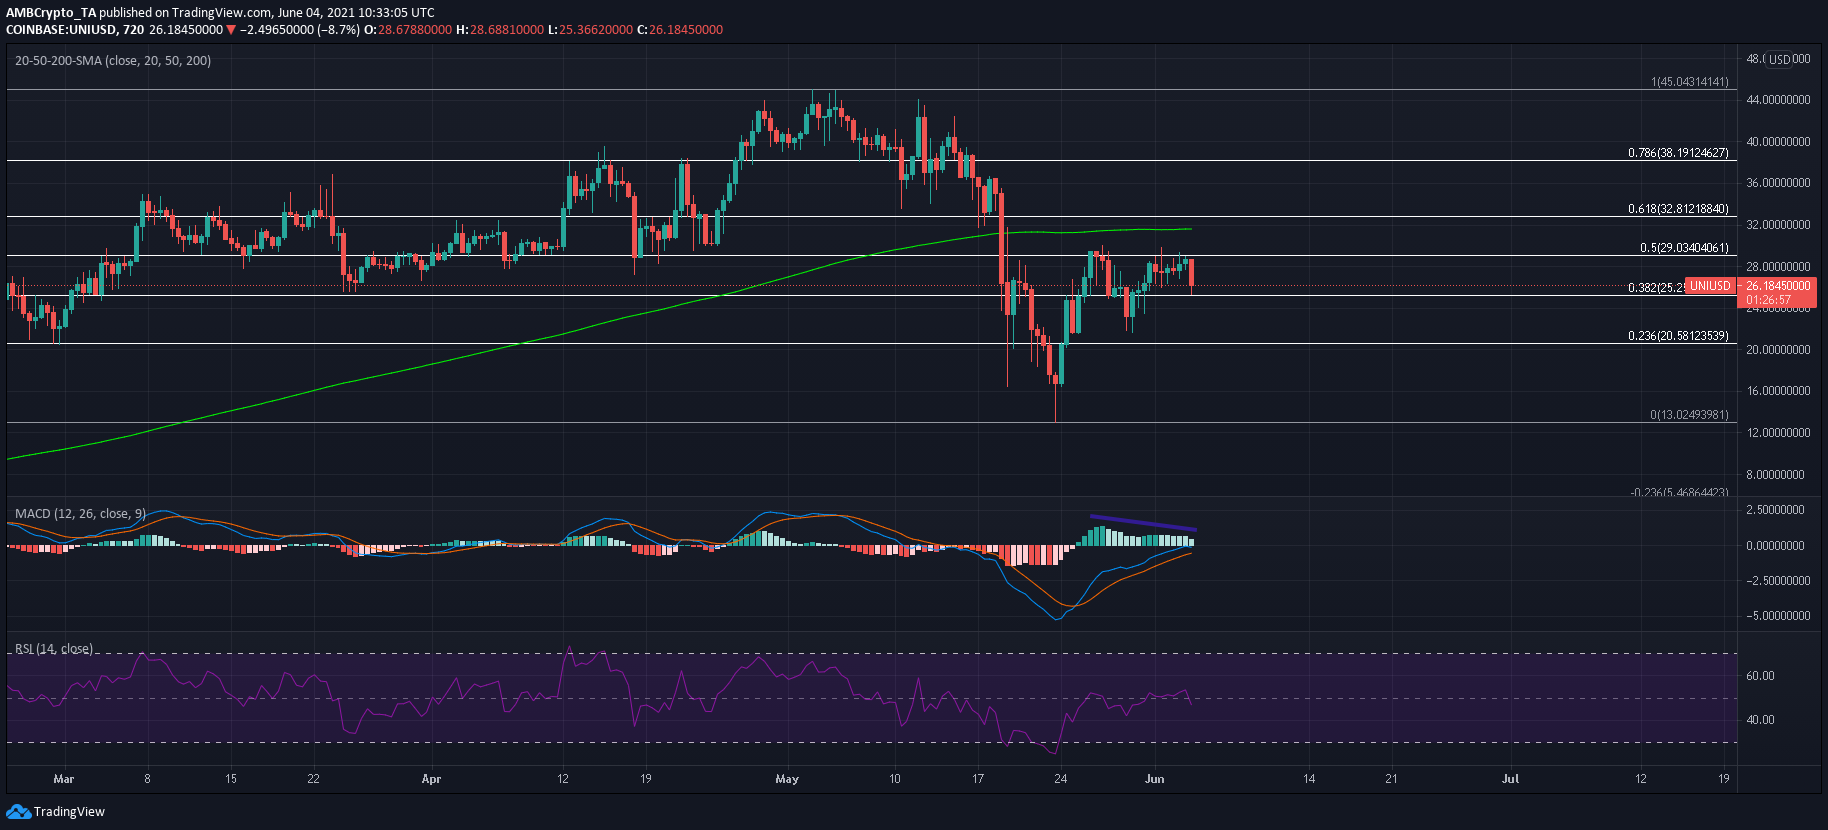
Much like its counterpart IOTA, Uniswap was also denied at a key resistance mark on its 12-hour timeframe. In UNI’s case, the price was unable to surge above the 50% Fibonacci level ($29.03) as the last session noted some selling pressure. Even though the MACD line traded above the Signal line, the histogram noted a degree of weakness.
A bounceback from the 38.2% level ($25.25) could allow for a bullish outcome, but losing out on the 23.6% level (20.58) could push UNI back to square one between $13-16. The RSI pointed south from 50 and could maintain some neutrality over the coming sessions.