


Disclaimer: The information presented does not constitute financial, investment, trading, or other types of advice and is solely the writer’s opinion.
- The market structure and momentum were bullish for Ethereum on the 4-hour chart.
- This could see ETH rally to $2000 but a rejection was also possible.
The Ethereum Shapella upgrade was successfully triggered and hailed as a historic milestone. It had no immediate impact on the price action, as this was an event the crypto sphere has known about for months now.
Read Ethereum’s Price Prediction 2023-24
While Ethereum continued its uptrend, there were fears that the accrued ETH from staking rewards could be sold in the market. Should traders anticipate a reversal in the uptrend?
The proximity to an HTF resistance zone meant late bulls can get punished
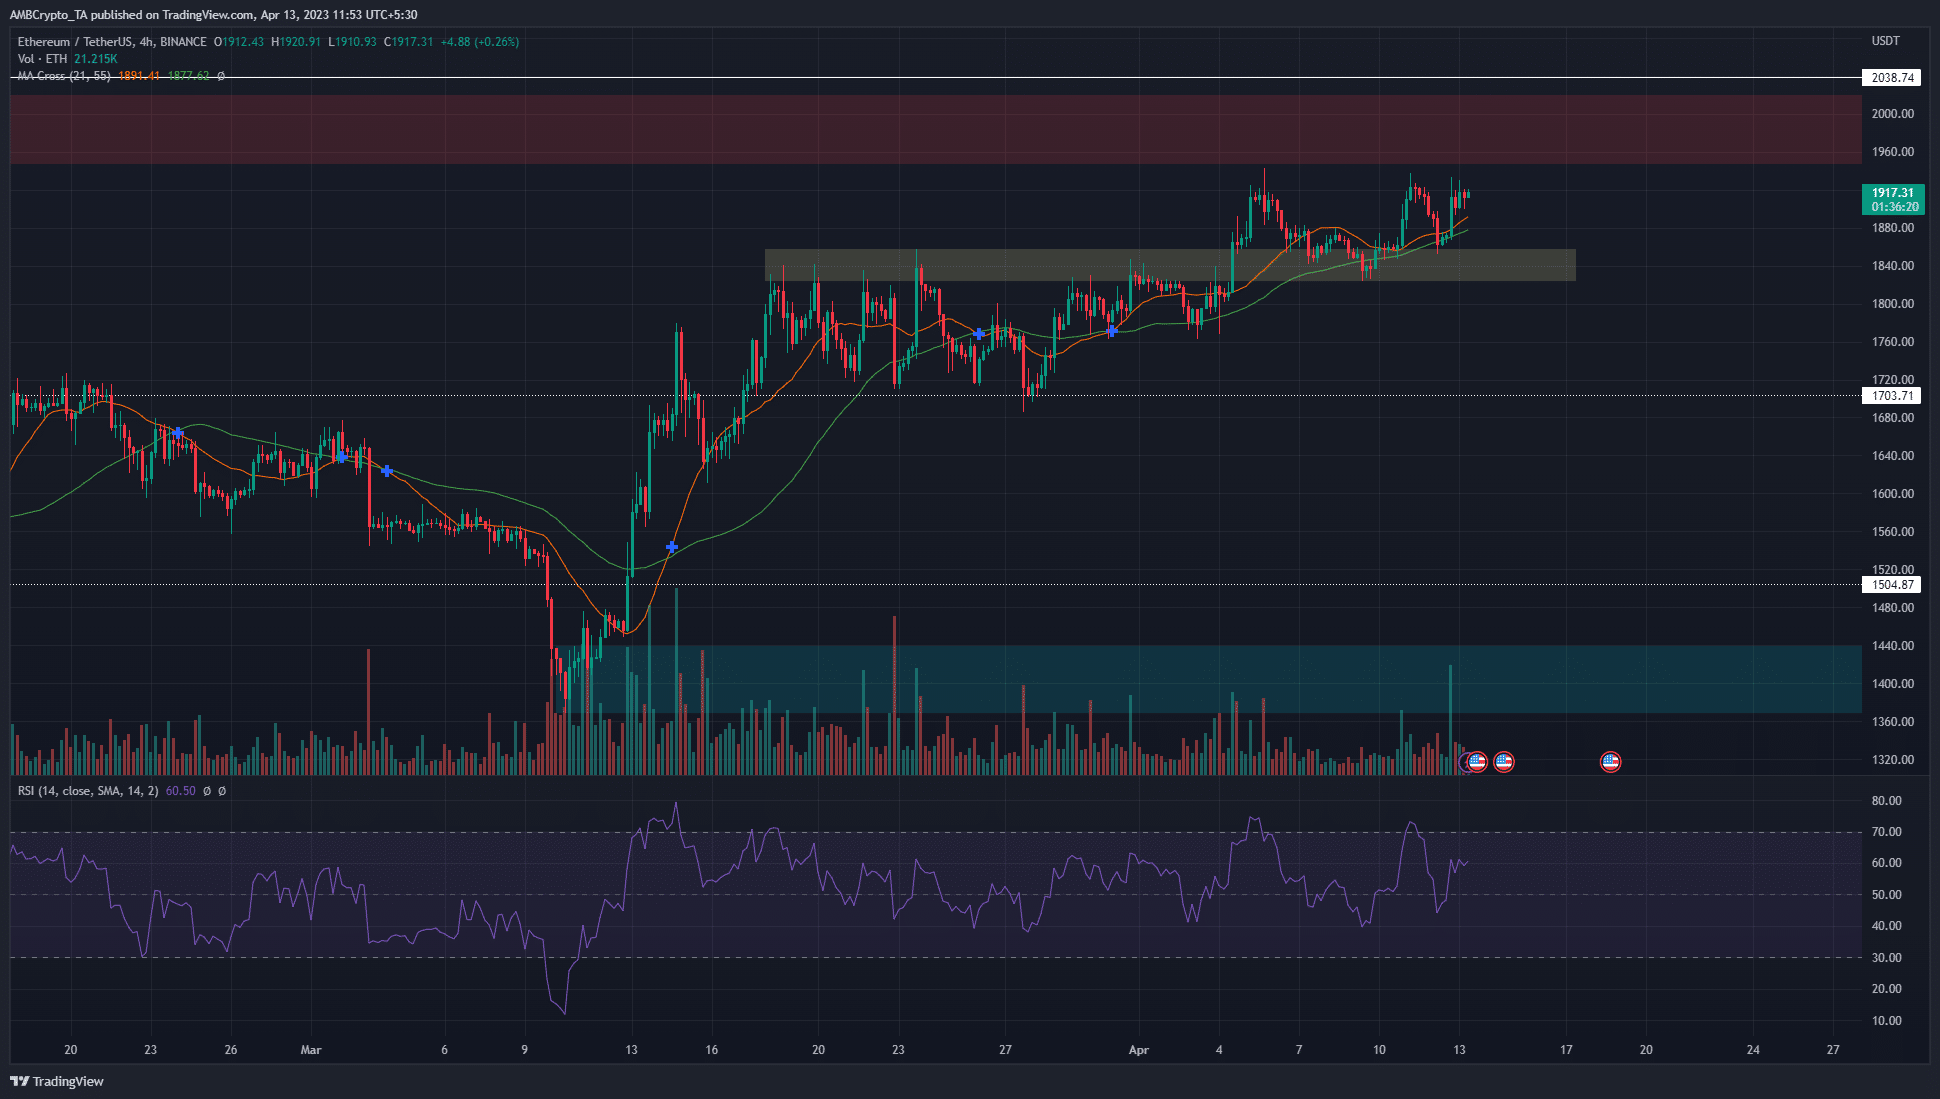
On the 4-hour chart, the 21 and 55-period SMAs showed a strong bullish trend. The RSI has been above the neutral 50 mark for the majority of the past three weeks, reinforcing the idea of bullish momentum.
The two higher timeframe zones of importance were marked in red and cyan. They represent the daily bearish and bullish order blocks respectively, at the $2000 and the $1400 area. ETH lost the $2000 level as support back in May 2022 and has not yet succeeded in flipping this area to support.
How much are 1, 10, or 100 ETH worth today?
Highlighted by the yellow box was another short-term zone of support at the $1850 region. ETH traders can look to sell the token in the $1950-$2050 area and wait for a clear breakout before re-entering. A revisit to the $1850 can also offer buying opportunities.
The Open Interest showed speculators remain bullish
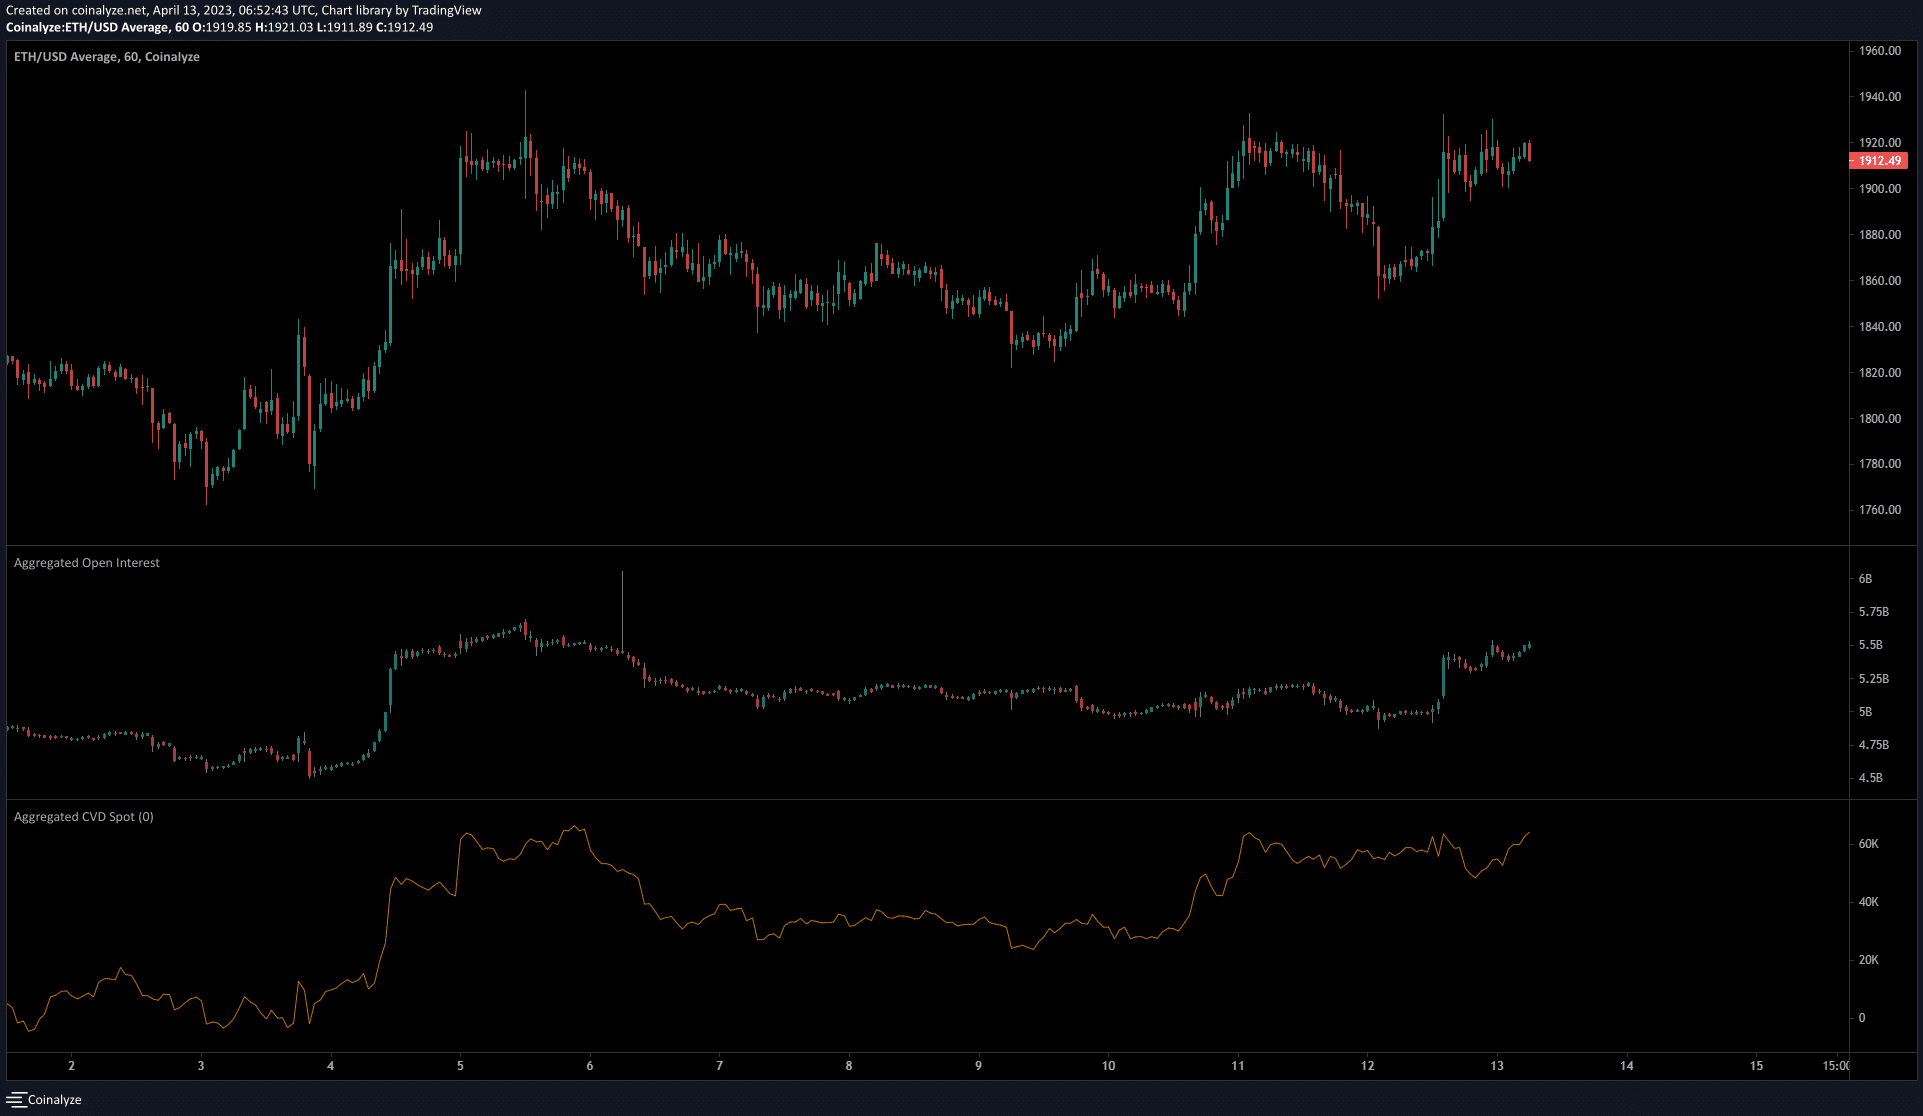
The spot CVD has been trending upward since late March. At that time, ETH was hovering around the $1700 support level and began to rally slowly. The rising CVD was accompanied by steady price gains which corroborated the demand behind ETH.
The Open Interest was flat since 6 April but began to pick up strongly on 12 April, and Ethereum also had a short-term rally back to the $1925 mark.
As things stand, more gains look likely, but a breakout past the $2020-$2040 area over the next week would be necessary before we can conclude a breakout past the high timeframe resistance.