Ethereum: Liquidation levels indicate move toward $2.8k resistance
The next week or two is expected to be bullish for Ethereum and a move toward $2.8k-$2.9k is likely.

- Ethereum regained a bullish structure but the downtrend was still in play.
- The former support zone at $2.9k could be the next price target.
Ethereum [ETH] has not been able to match the performance of Bitcoin [BTC]. This was reflected in the ETH/BTC chart, which could be forming a local bottom. Compared to the US dollar, the token is expected to perform much better in the coming days.
The liquidation levels and the price action charts gave clues that a 5% move northward is likely, but any gains beyond that would need a major intrusion from buyers.
Ethereum approaches a local high and pivotal resistance zone
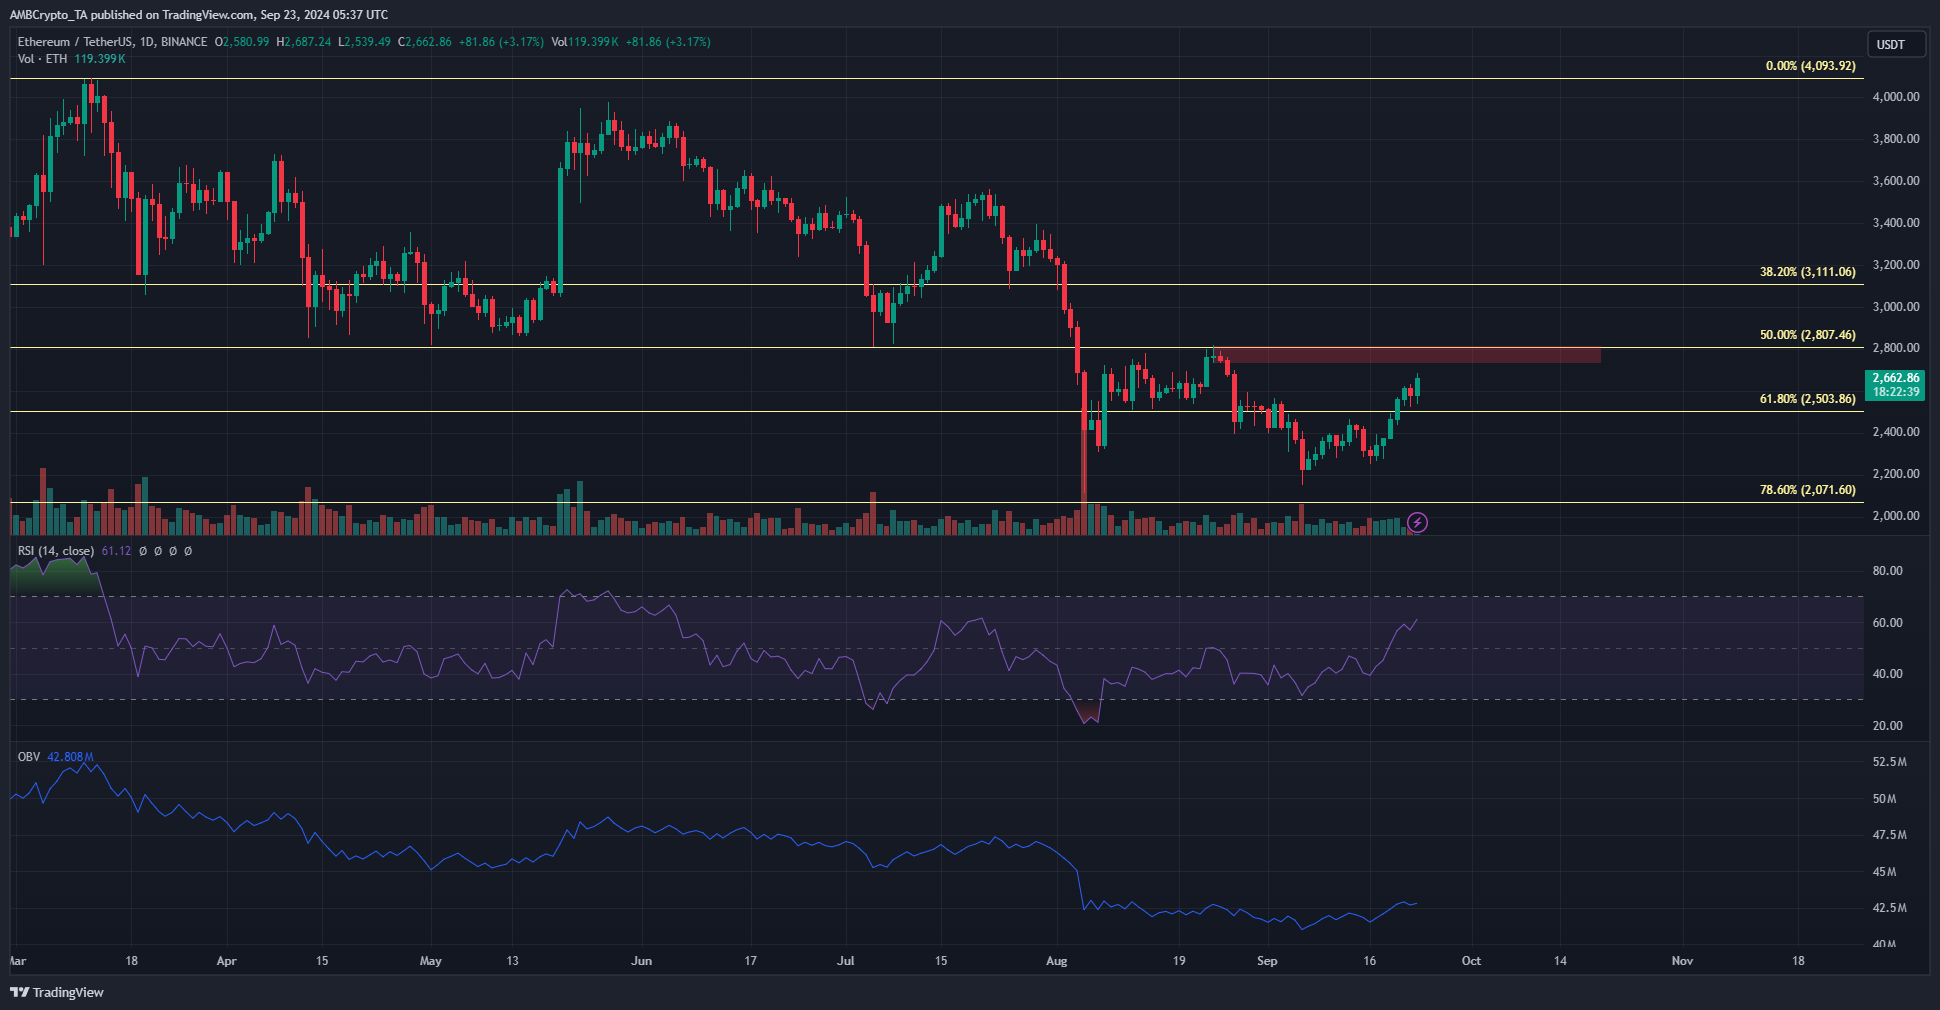
The market structure on the daily timeframe was bullish after the price beat the most recent lower high at $2,464. The RSI was also above neutral 50 to indicate the momentum has changed direction.
However, this does not mean the trend is bullish- the trend has been bearish since June, after the attempted recovery failed in May. The OBV agrees with this statement and has been trending downward since March to denote weak buying pressure for the most part.
There was a bearish order block at the $2.8k level. The market structure had flipped bearishly from this local high in mid-August, marking it as a strong supply zone.
Ethereum will likely visit this resistance, but a breakout depends on market-wide sentiment and news developments.
Another piece of evidence for the $2,800 target
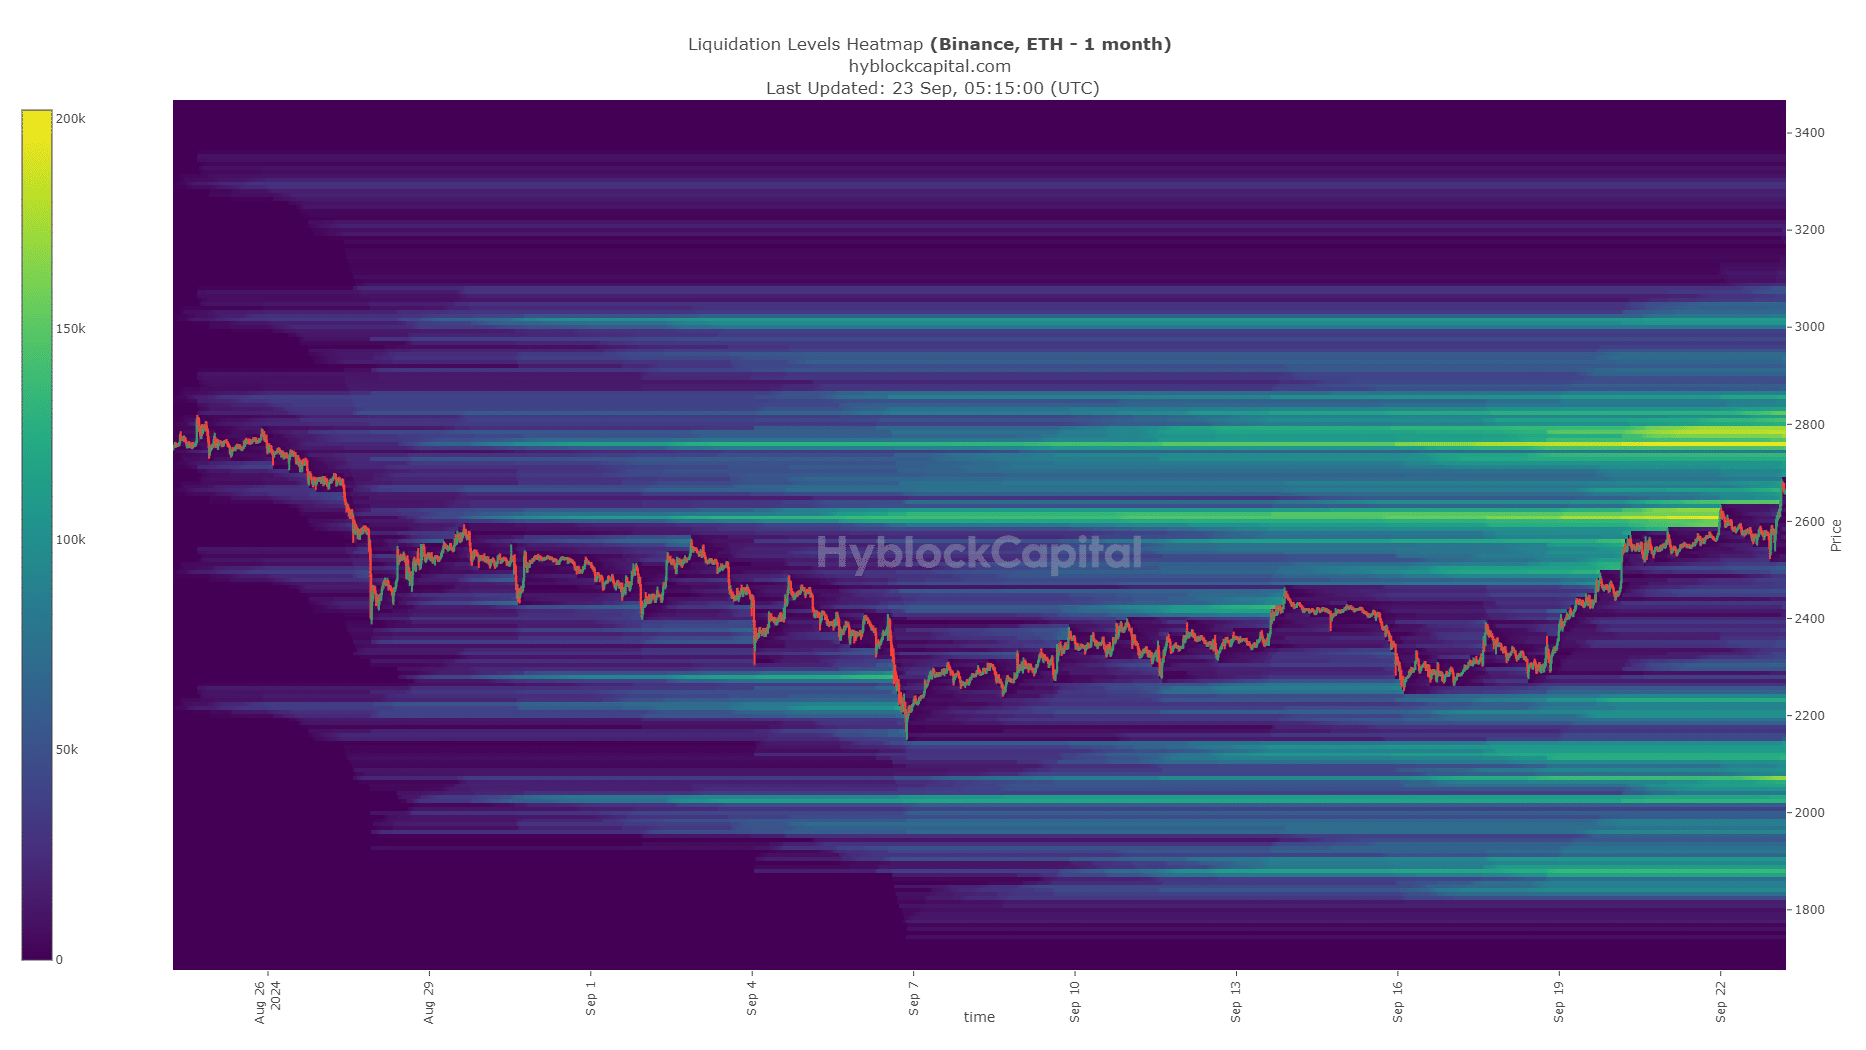
The $2.8k region has a large cluster of liquidation levels, highlighting it as a key magnetic zone in the short term. Therefore, in this week of trading, it is expected that Ethereum will sweep this region before a potential reversal.
A reversal is anticipated only because the $2.8k-$3k region has been a significant support/resistance zone since April. It is likely to have many sellers, but bulls may overpower them, especially if Bitcoin continues to rally higher.
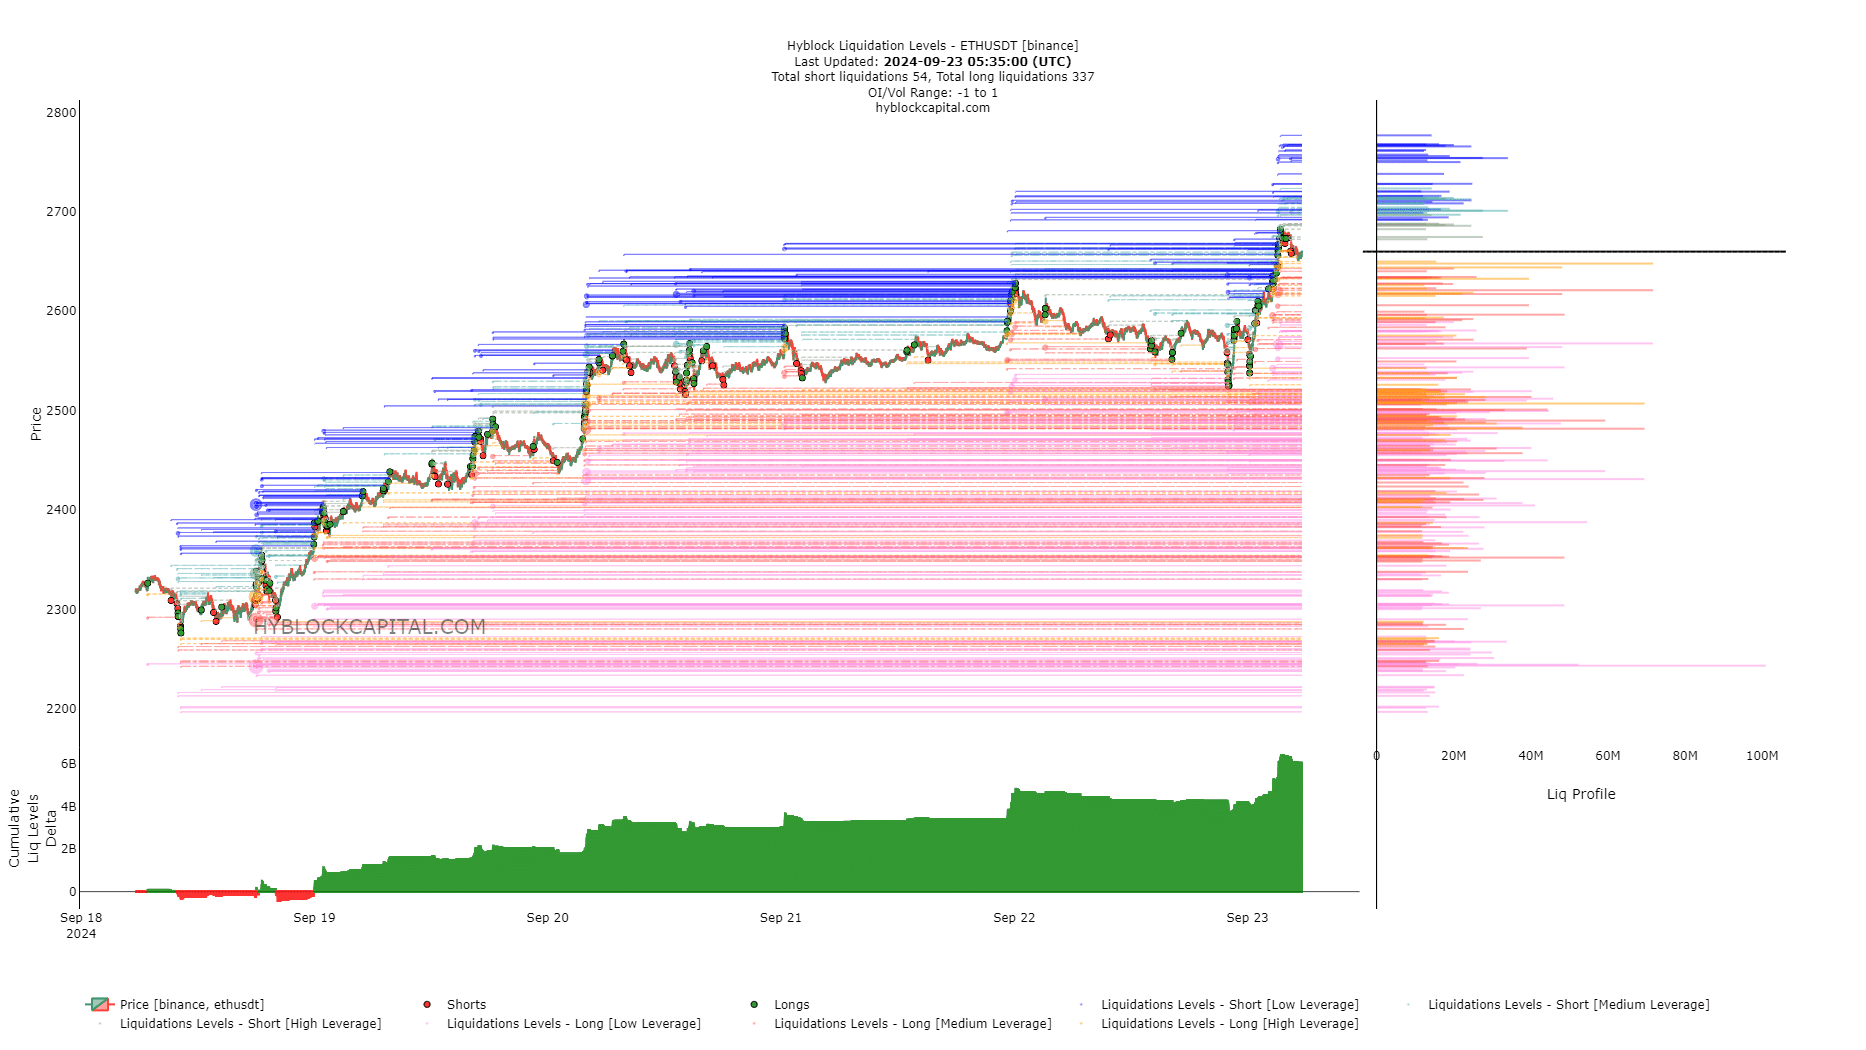
In the short term, there were high-leverage long positions at the $2,647 and $2,621 levels that could be targeted in a liquidity hunt.
Read Ethereum’s [ETH] Price Prediction 2024-25
The positive cumulative liq levels delta suggested a near-term price retracement was possible.
The next week or two is expected to be bullish for Ethereum. A move toward $2.8k-$2.9k is likely. Further gains would depend on market sentiment and the strength of the buyers which will be on display in the trading volume.
Disclaimer: The information presented does not constitute financial, investment, trading, or other types of advice and is solely the writer’s opinion