Ethereum
Ethereum makes efforts to stabilize its price – is it working?
Daily Active Addresses on the Ethereum network have spiked to a 10-month high.


- Ethereum saw a record number of daily active addresses.
- ETH’s support has continued to hold.
Ethereum’s [ETH] recent spike in a key on-chain metric is noteworthy, especially considering its recent price trends and its struggle to maintain levels above a critical support line.
However, it’s interesting to note that despite this spike, other on-chain metrics have displayed typical patterns.
Ethereum sees more active addresses
AMBCrypto’s analysis of Ethereum’s Daily Active Addresses metric from Santiment revealed recent consecutive spikes, indicating a significant increase in network activity.
On the 21st of June, the number of daily active addresses reached over 617,000, marking the highest level since the 23rd of March.
However, this record was surpassed the very next day, on the 22nd of June, setting another high point.
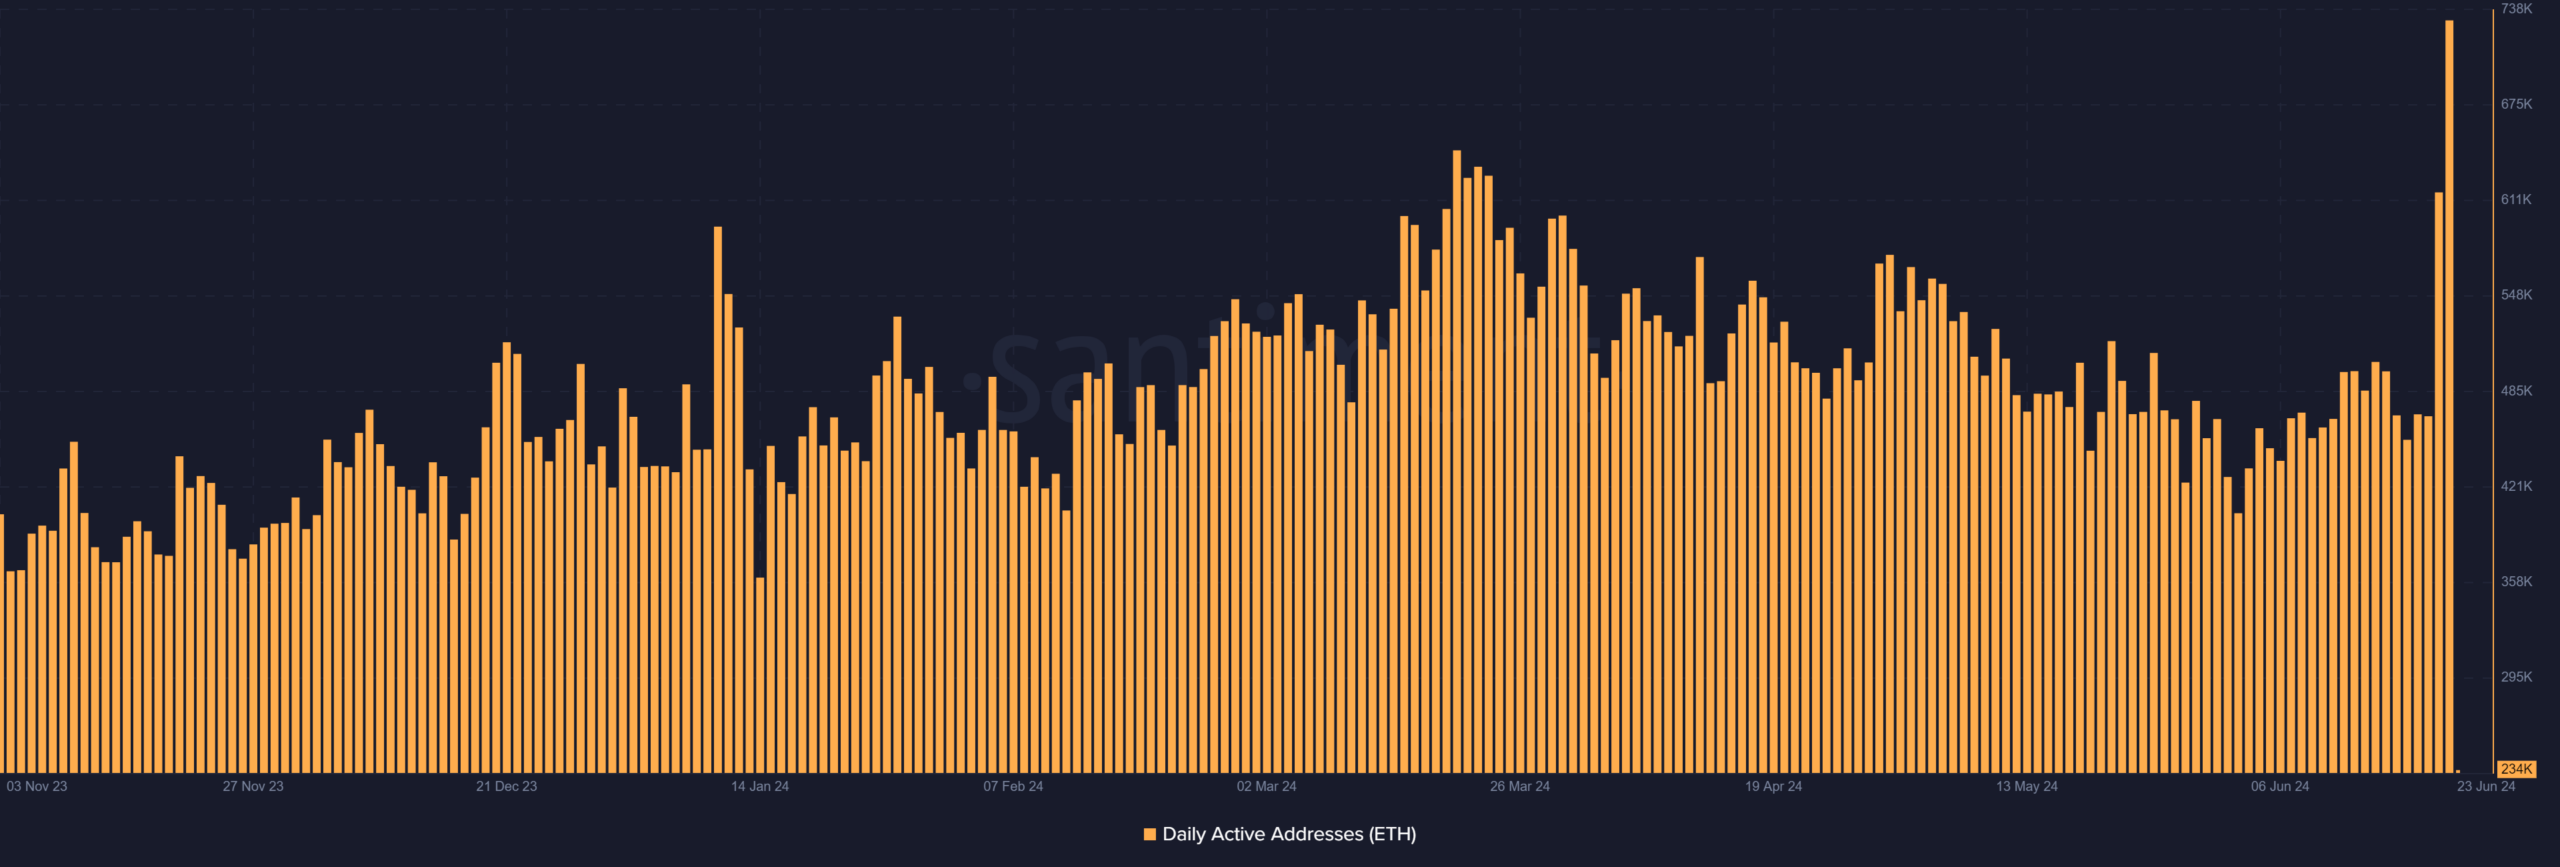
Source: Santiment
Ethereum’s Active Addresses indicated that by the close of trading on 22nd June, the number of daily active addresses exceeded 731,000.
AMBCrypto then took a deeper look at the historical data, which revealed that the last occurrence of such high activity was around ten months ago.
In September 2023, the number of active addresses surged to over 1 million, marking the highest recorded level up to that point.
These spikes suggest a heightened level of engagement on the Ethereum network, which could be driven by various factors such as market movements, new developments in the ecosystem, or increased adoption.
However, these spikes did not impact the volume.
What of Ethereum’s volume?
AMBCrypto’s analysis of Ethereum’s
trading volume reveals an interesting contrast to the spikes in daily active addresses. Despite the increase in active addresses, trading volume declined.By the end of trading on the 22nd of June, the volume stood at around $9 billion, which might initially seem substantial.
However, when compared to the $15 billion recorded in the previous trading session, this represents a significant decrease.
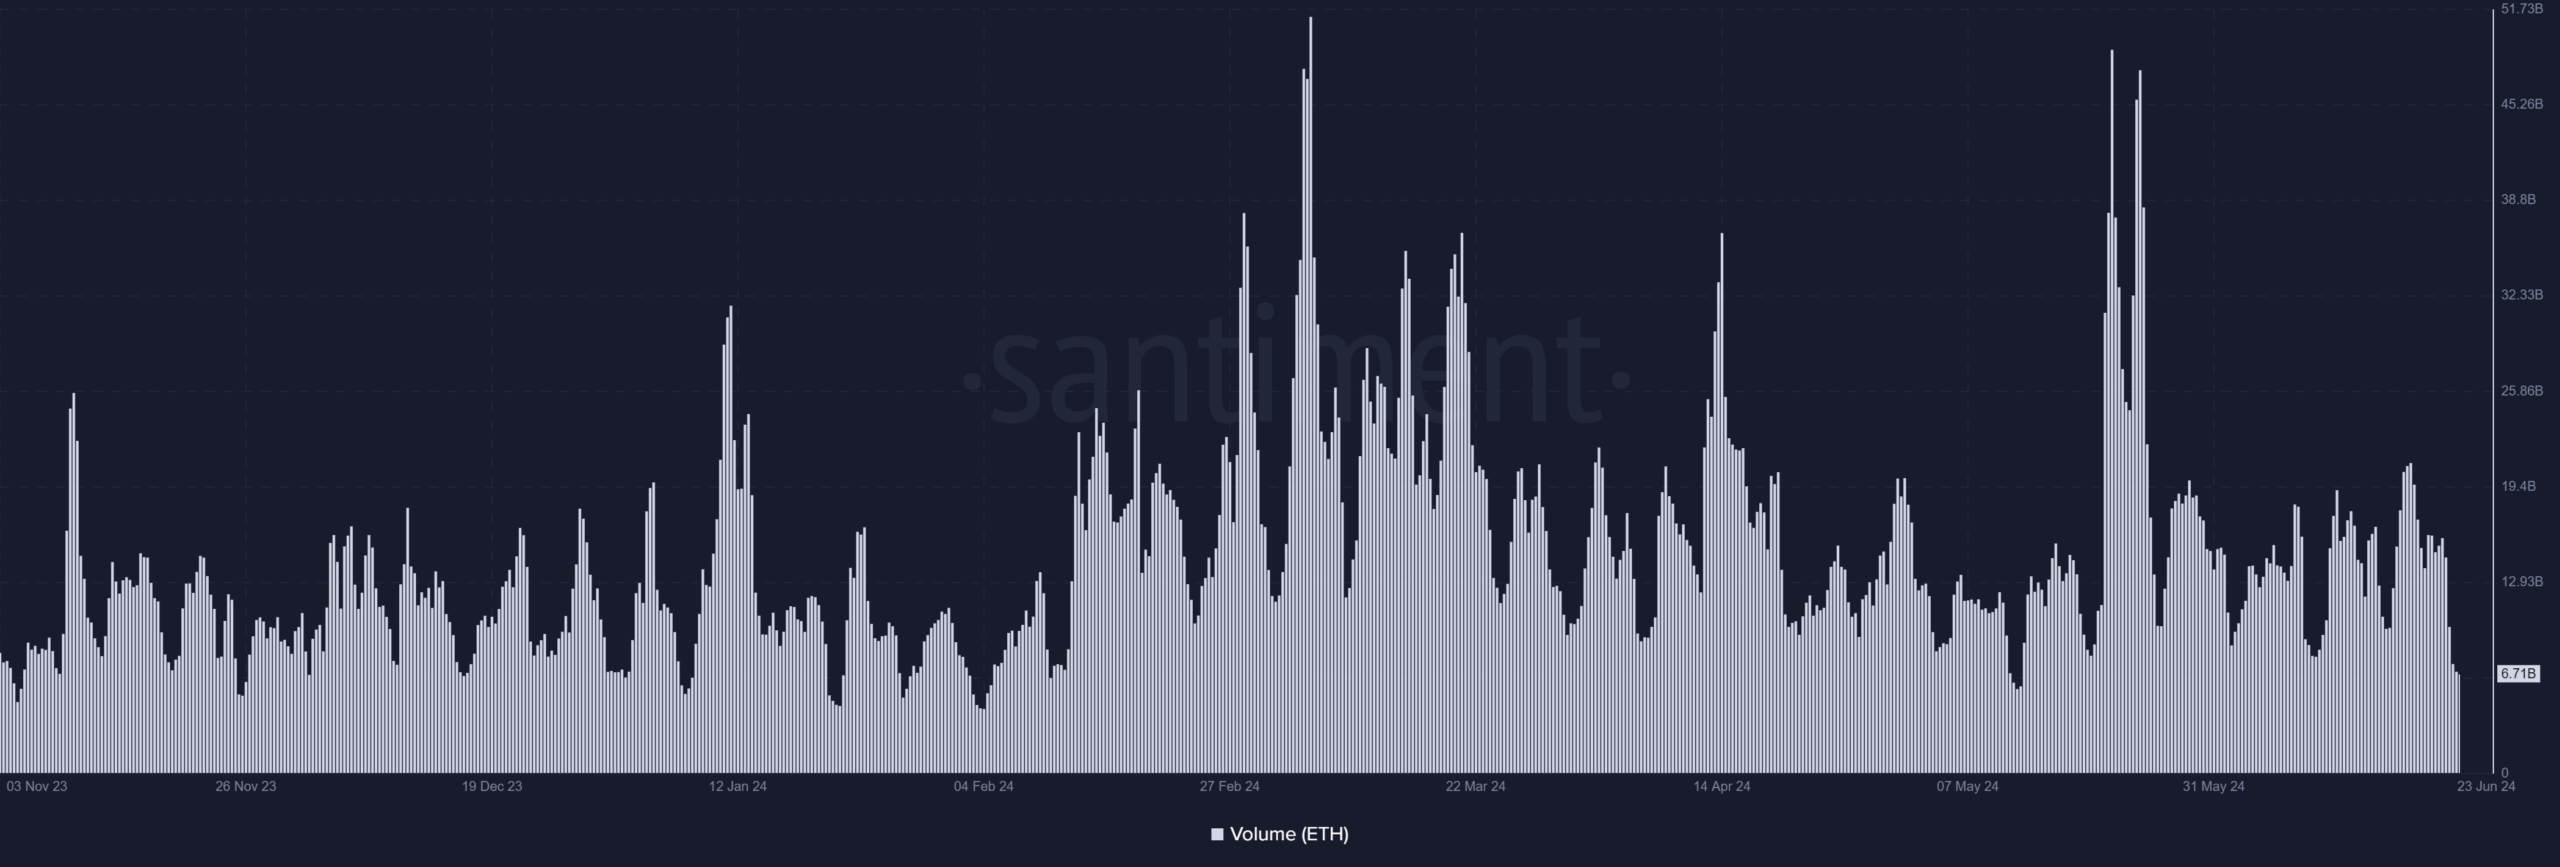
Source: Santiment
The discrepancy suggested that while more addresses were active, possibly indicating increased user interactions or transactions on the network, these did not translate into higher trading volumes.
This pointed to possibly smaller, less value-intensive transactions dominating the activity during the period.
ETH’s bear trend weakens
Ethereum’s price chart indicated that it was currently striving to maintain its support level.
AMBCrypto’s review of the daily timeframe chart showed that although there has been a decline in its price over the last few days, the support level has effectively held at around $3,400.
As of the latest data, Ethereum was trading at approximately $3,490, experiencing a slight decline.
This suggests tentative stability, as it manages to stay above the crucial $3,400 support level, which could be pivotal in determining its short-term price trajectory.
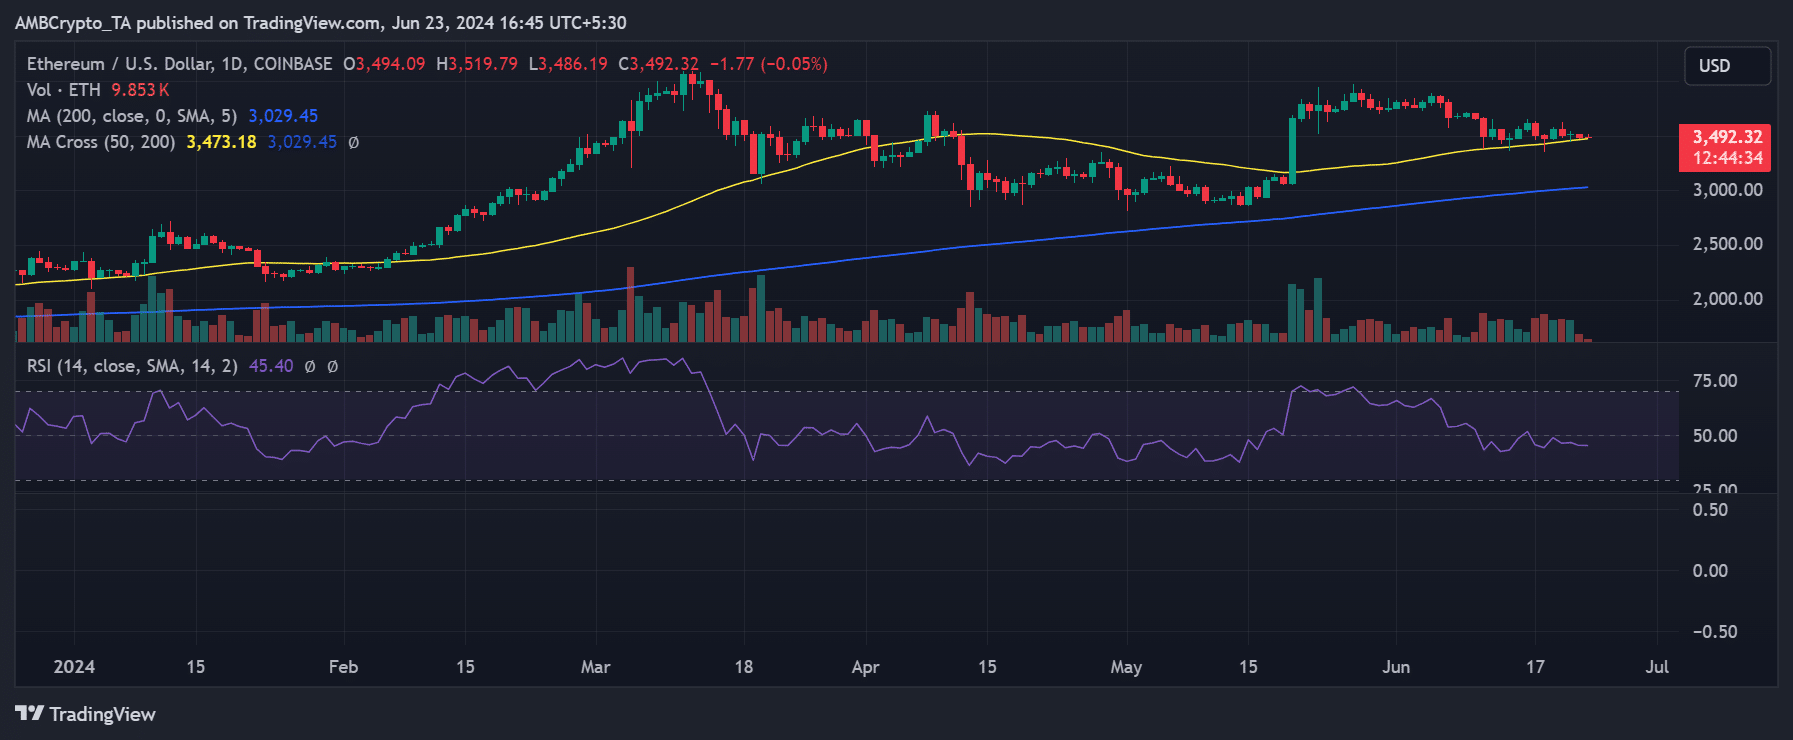
Source: TradingView
Is your portfolio green? Check out the ETH Profit Calculator
The analysis of Ethereum’s Moving Average Convergence Divergence (MACD) indicated that it was in a bearish trend at press time.
However, the behavior of the MACD lines suggested that this bearish trend was weakening. Should the price increase, this could diminish further, potentially signaling a reversal or at least a slowdown in downward momentum.