Ethereum, NEAR, EOS Price Analysis: 25 January

While broader sentiment still refrained from changing, Ethereum and EOS gravitated toward their multi-month/yearly lows on 24 January. Now, their near-term indicators hinted at decreasing selling power, but they still needed increased volumes to propel a sustained rally.
On the other hand, NEAR kept declining after striking its ATH on 15 January.
Ether (ETH)
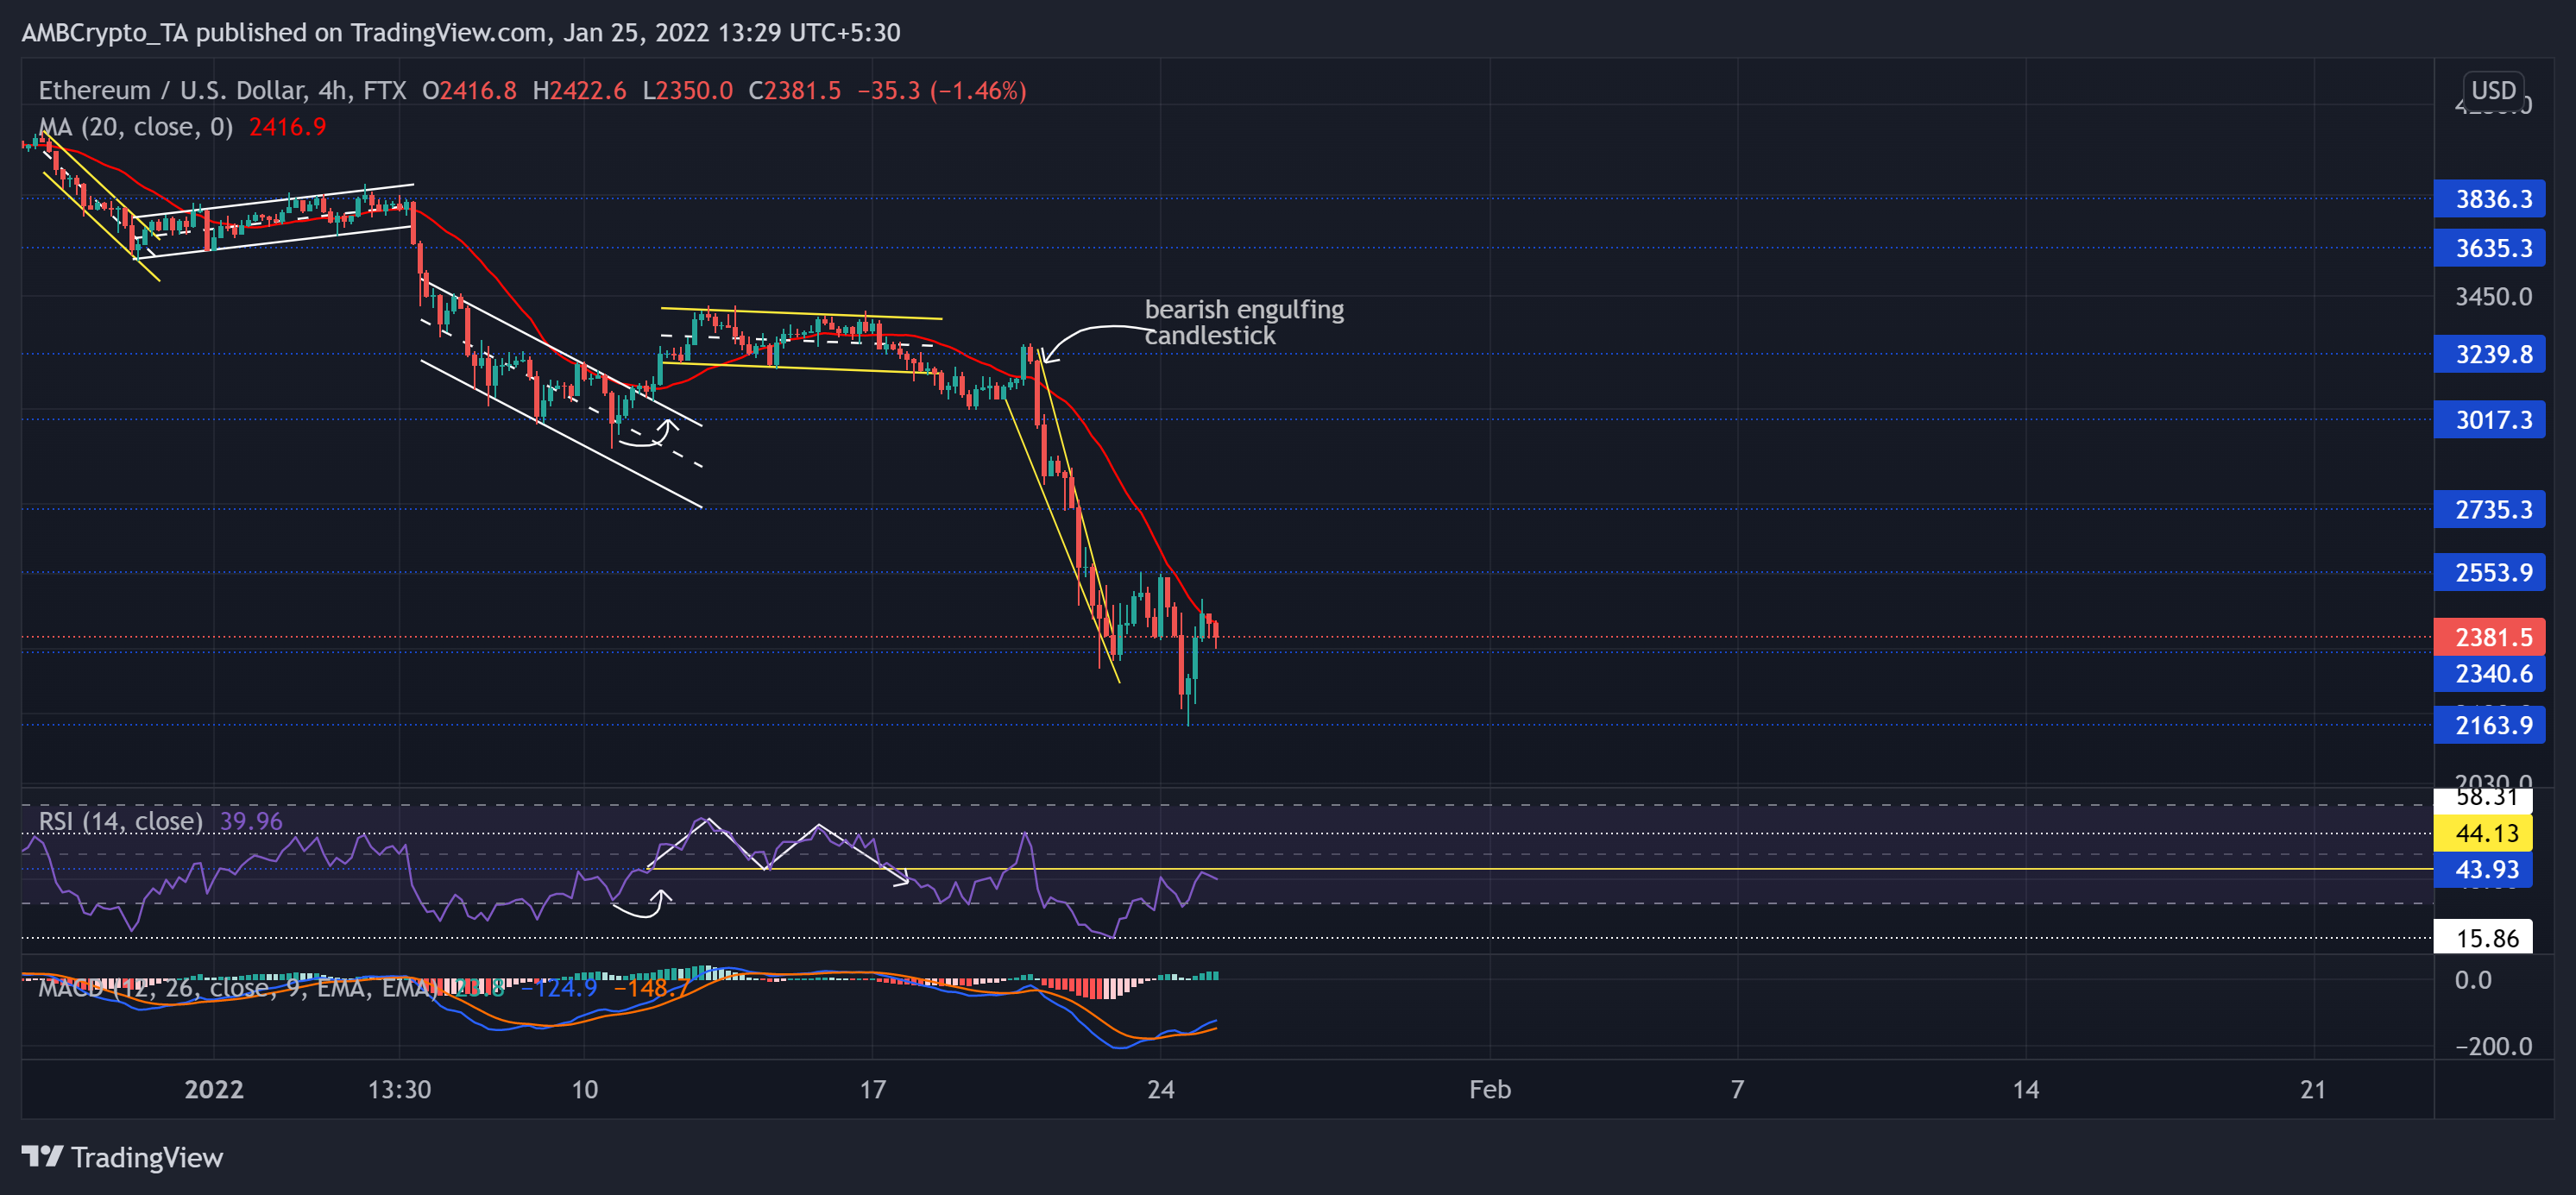
Following the market-wide fallout on 21 January, ETH bulls failed to step in and defend the crucial $3,000-mark support (now resistance). ETH registered a 33.84% loss (from 20 January high) and touched its six-month low on 24 January.
The recent falling wedge (yellow) breakout halted at the $2,550-mark. Since then, the 20 SMA (red) stood as a strong barrier for the bulls.
At press time, ETH was trading at $2,381.5. Following the broader sell-off, the RSI saw a 43 point plunge until it hit its 22-month low on 22 January. Then, it bounced back but still struggled to cross the 44-mark resistance. Also, the MACD confirmed the bearish vigor, but its histogram found a close above the equilibrium. This reading hinted at the decreasing bear influence.
Near Protocol (NEAR)

NEAR defied the broader market trajectory by being on an uptrend since early December. The alt saw a staggering 56.7% ROI (from 10 January low) and marched toward its ATH at $20.597 on 15 January.
Since then, it lost 53.83% of its value while losing the vital $13.2-level resistance (previous support). With the gains over the past day, Bulls created a near-term demand zone (rectangle, green) for the alt. Now, the immediate hurdle for them stood at the $10.9-mark.
At press time, the alt traded at $10.364. After plunging to its record low at 18.4, the RSI saw a solid revival in the past three days. A sustained close above 33.9 would further open up a recovery possibility. Interestingly, the OBV still maintained its support that upheld higher prices over the past month. This reading displayed a potential comeback possibility for the bulls. Besides, the Squeeze Momentum Indicator hinted at a near-term low volatility phase.
EOS
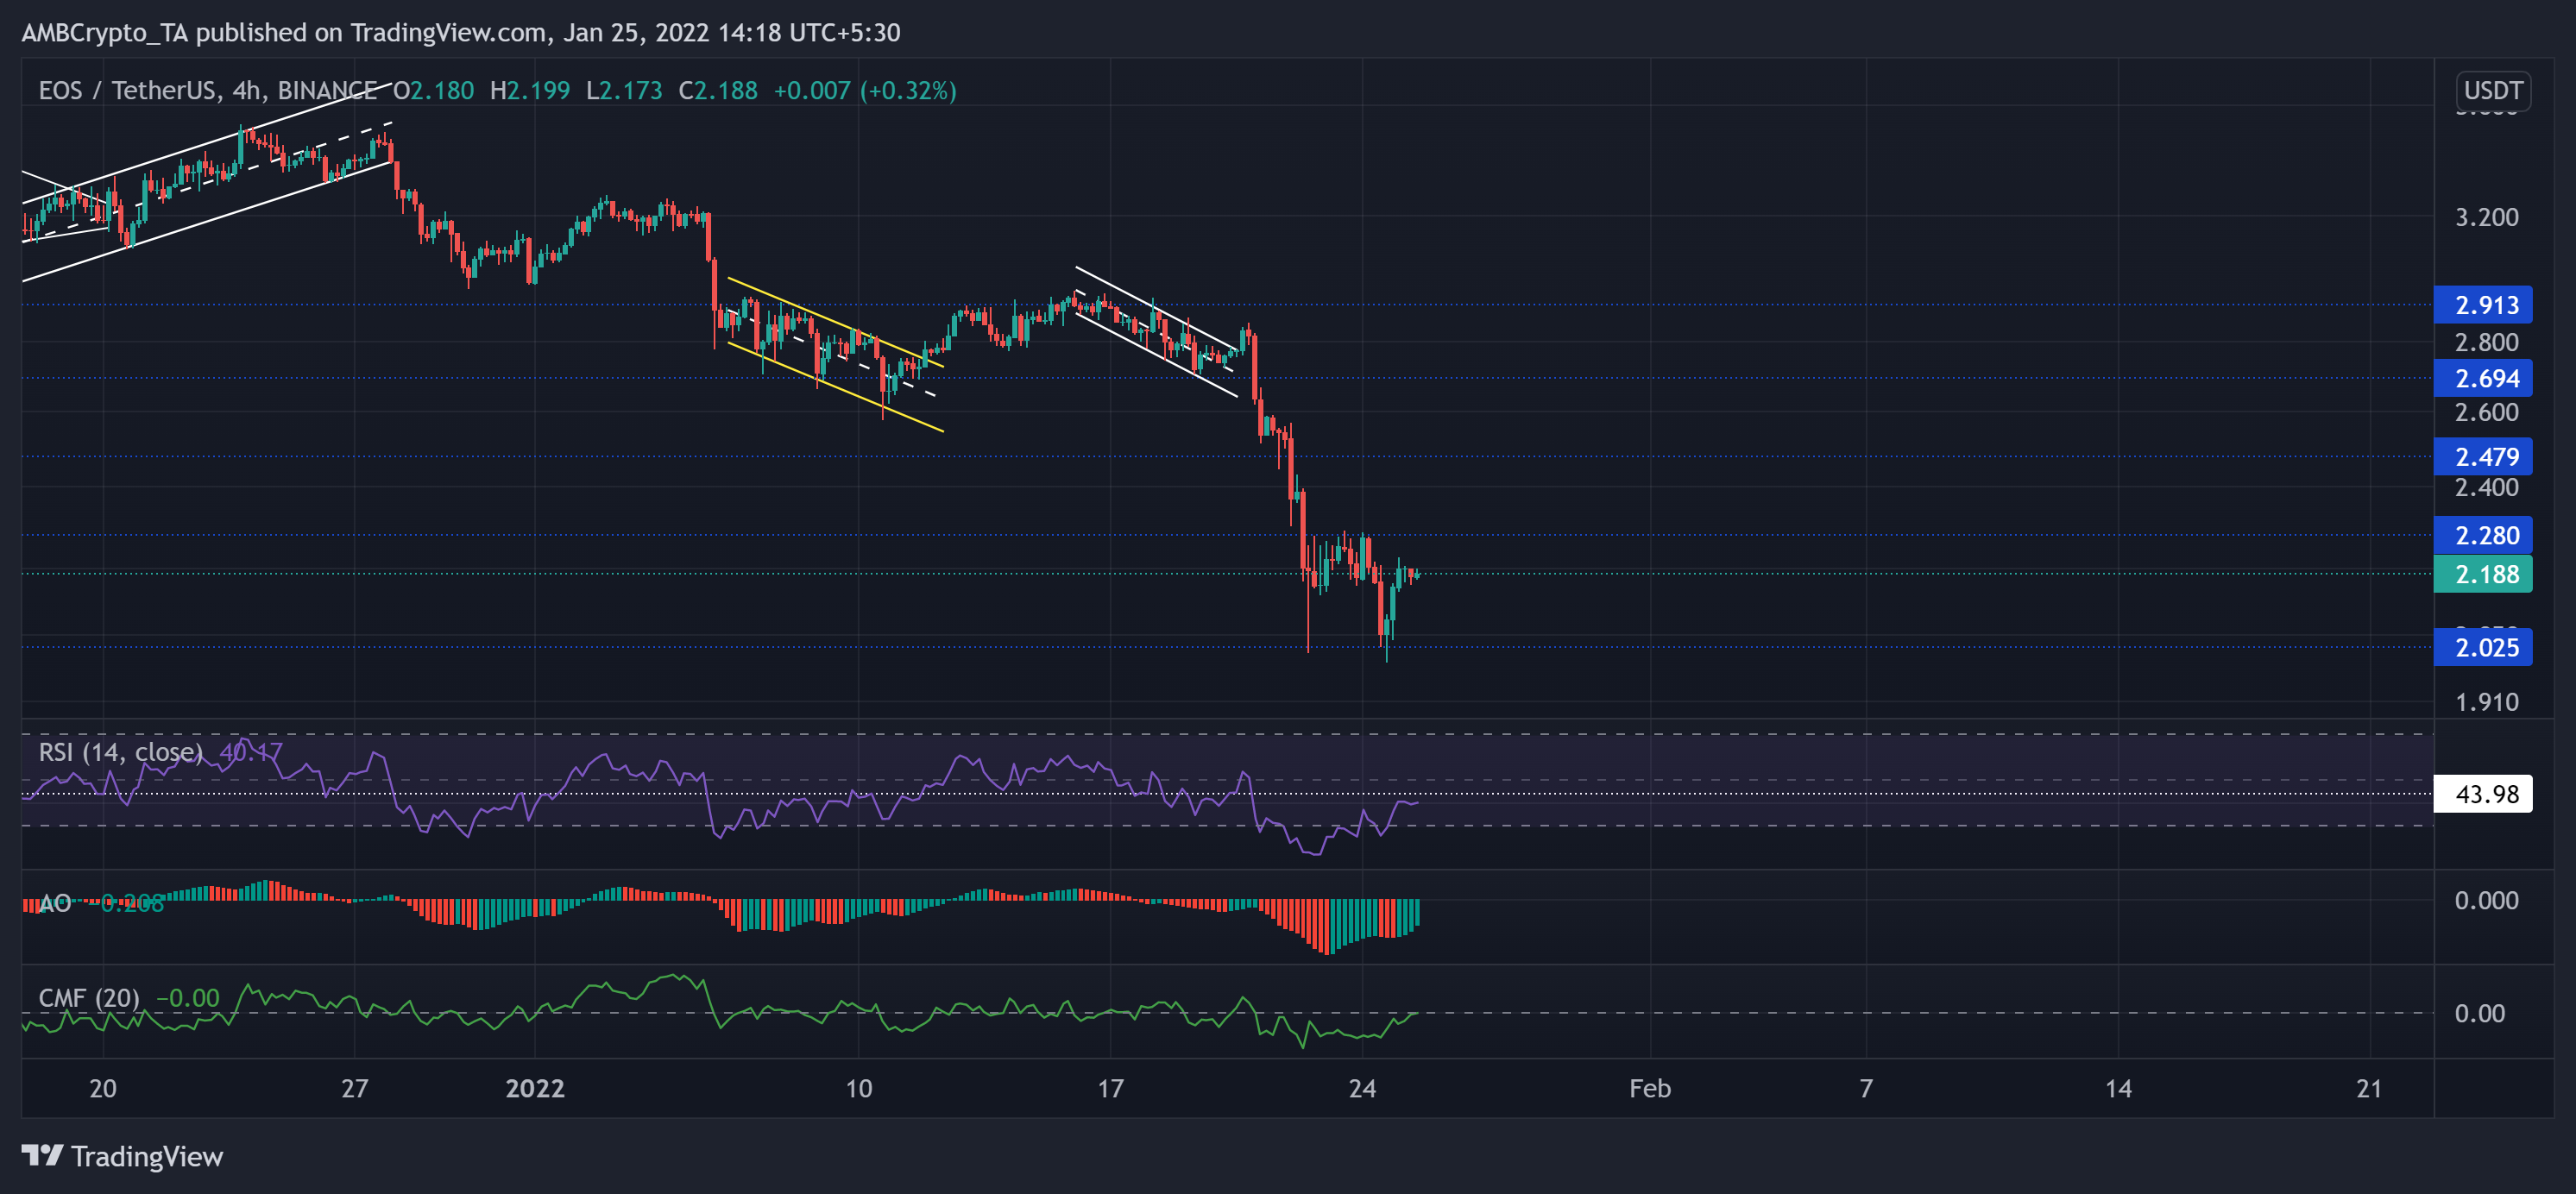
As the sellers stepped in at the $2.9-zone, EOS plunged into a down-channel (white). Then, the patterned breakout was short-lived with the broader fallout as EOS marked a 30.41% decline and touched its 22-month low on 24 January. Now, the immediate testing point for the bulls stood at the $2.28-mark
At press time, EOS traded at $2.188. The RSI chose the bears but slightly improved as it rose from the oversold region. Further, the AO asserted a bearish bias, but it flashed green bars, pointing at the decreasing selling power. Although CMF improved, it still needed to close above the zero-line to confirm a strong recovery.


