
All about Trump Jr.-linked firm raising $50M to expand into crypto

- Ethereum’s fees hit a six-month low in the past seven days.
- ETH was down by 6%, and metrics looked bearish.
As L2s gain popularity, Ethereum’s [ETH] network usage plummets, reaching a six-month low.
This aligned with Vitalik Butarin’s 2020 roadmap, which aimed to enhance scalability by offloading transactions from the mainnet.
In the meantime, ETH bears entered the market and pushed the token’s price down.
Ethereum’s network activity dwindles
IntoTheBlock recently posted a tweet highlighting the fact that ETH’s fees plummeted to a 6-month low this week as it dropped by over 29%.
The drop in ETH’s fees reflected a shift in activity to over 50 live Layer 2 networks. To see what’s going on with Ethereum, AMBCrypto analyzed Artemis’ data.
Notably, overall activity on the network had dropped, alongside the blockchain’s Daily Active Addresses declined last week.

Source: Artemis
ETH’s Daily Transactions also followed a similar trend. The decline in fees also caused the blockchain’s revenue to drop last week.
Notably, it was surprising to see the blockchain’s usage drop when its gas price declined. As per Ycharts, ETH’s gas price dipped from 47.5 Gwei to 8.5 Gwei over the last month.
Ethereum turns bearish
While the blockchain’s network activity dwindled, its price action also turned bearish. According to CoinMarketCap, ETH’s price has dropped by more than 6% in the last seven days.
At the time of writing, it was trading at $2,920.99 with a market capitalization of over $350 billion.
AMBCrypto’s look at Glassnode’s data revealed a possible reason behind this price decline. We found that ETH’s number of addresses with balances greater than $100k sank over the last seven days.
This clearly indicated that whales were selling their holdings.
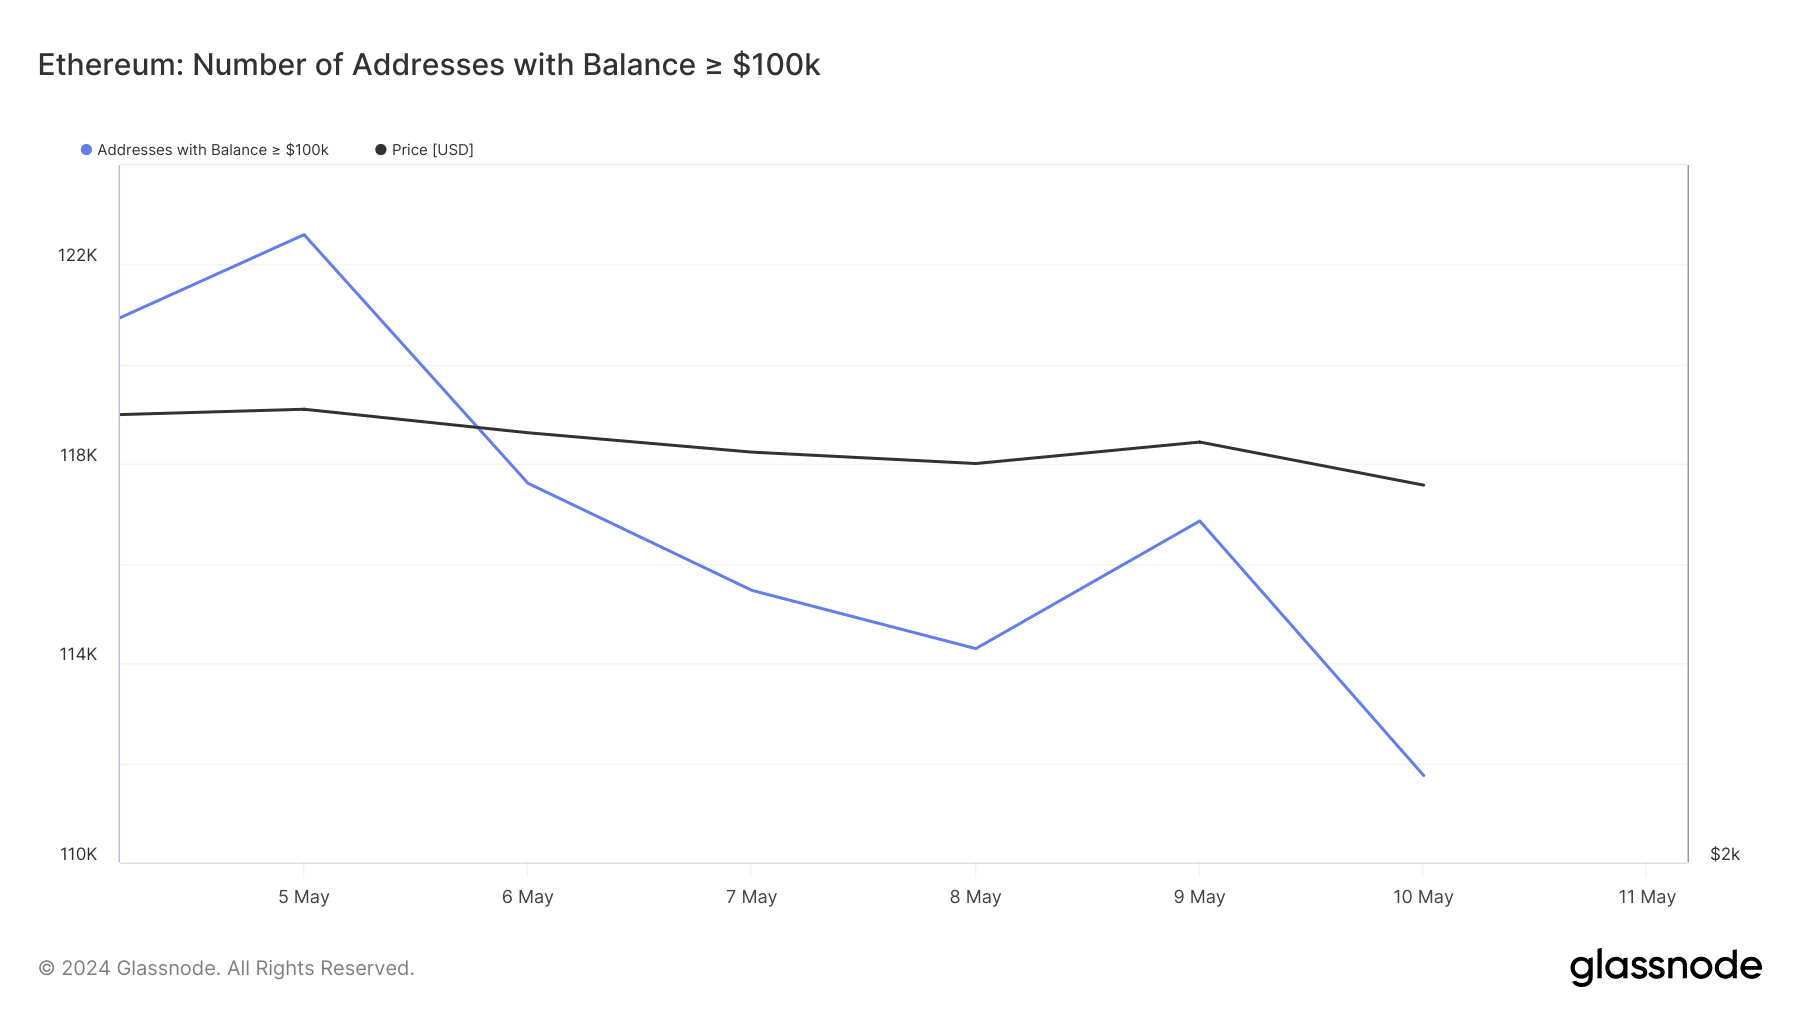
Source: Glassnode
Not only whales, but selling sentiment was overall dominant in the market. Our analysis of Sentiment’s data pointed out that ETH’s Exchange Inflow spiked twice last week.
Additionally, its Supply on Exchanges increased. This hinted at a sell-off, which might have triggered the price correction.
The negative price action also had a negative impact on market sentiment. Ethereum’s Weighted sentiment dropped in the last few days, suggesting that bearish sentiment around the token was dominant.
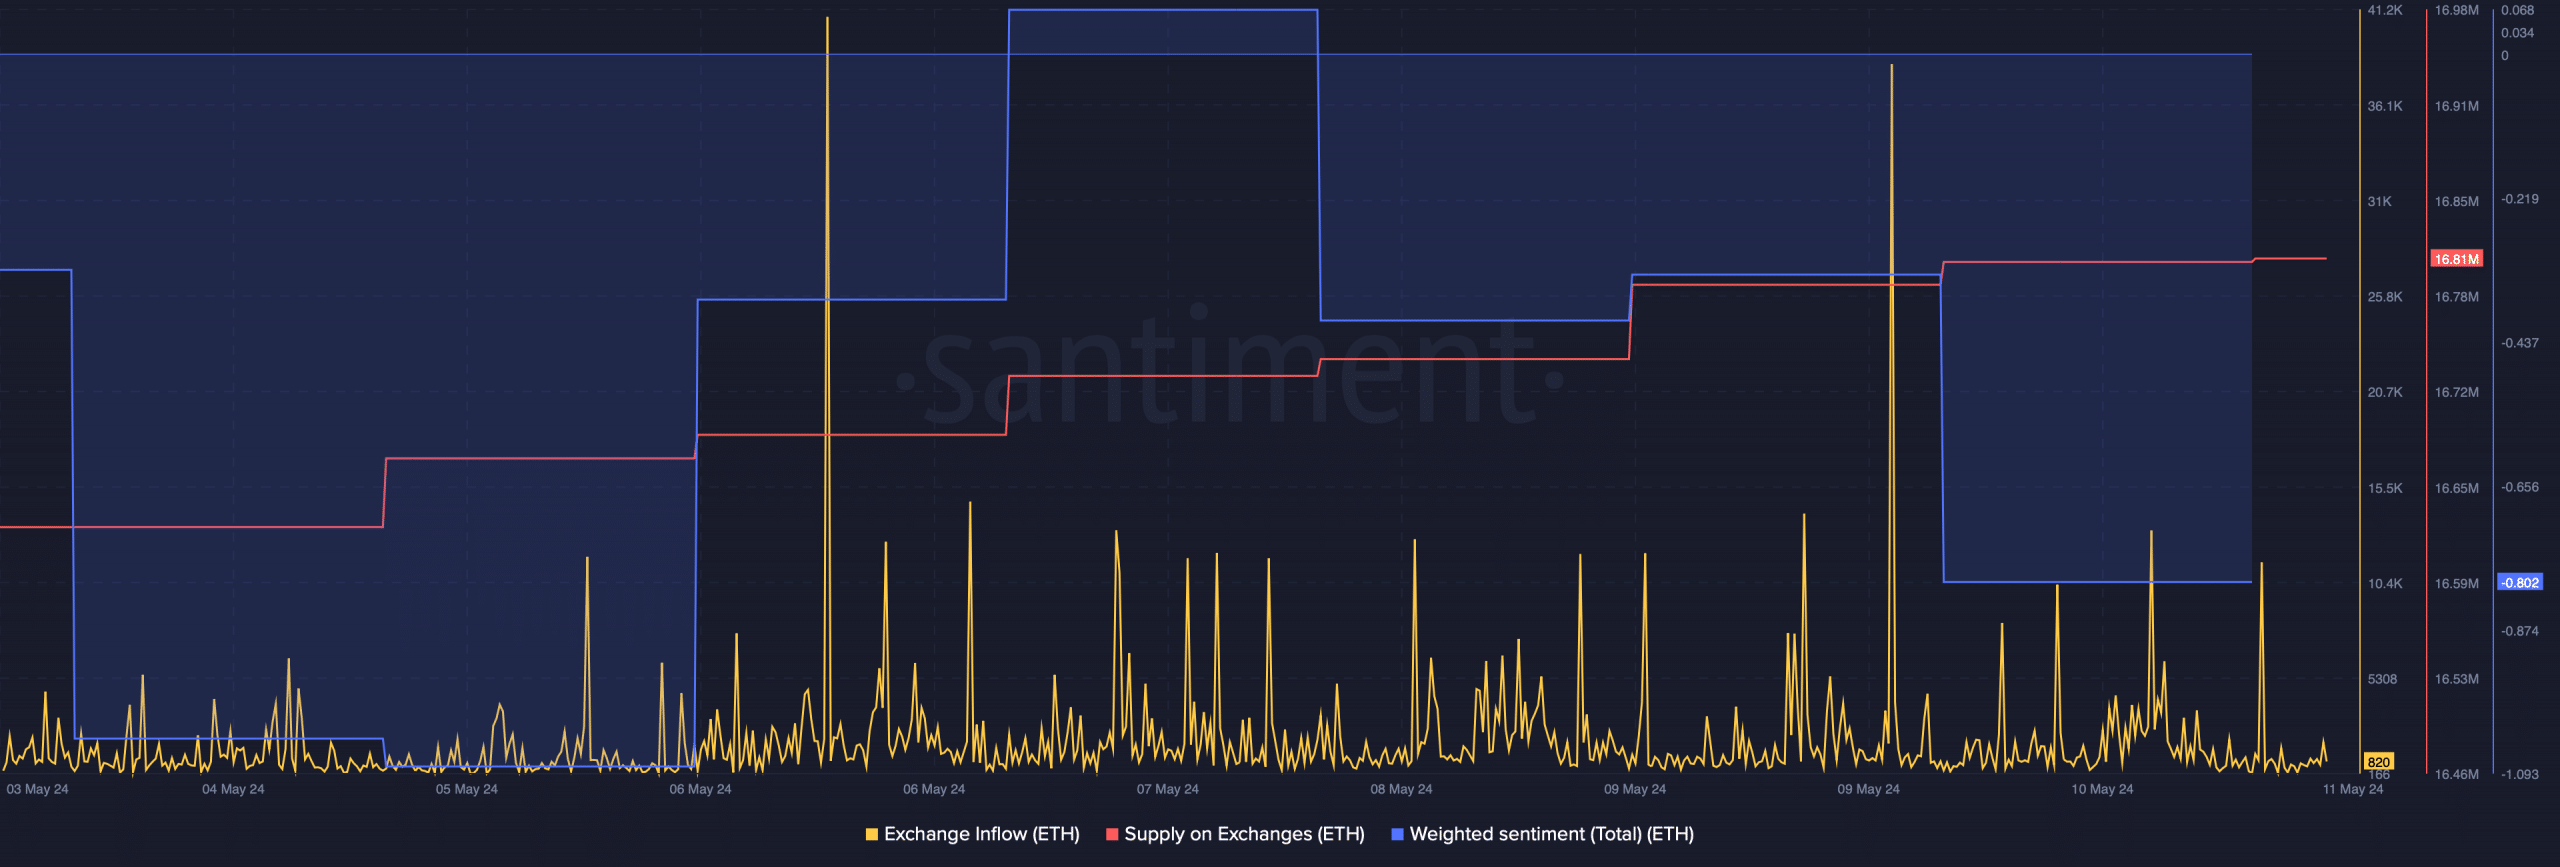
Source: Santiment
AMBCrypto then analyzed ETH’s daily chart to see whether a further price drop is likely to happen.
We found that its Relative Strength Index (RSI) was resting under the neutral mark. Its Money Flow Index (MFI) also registered a downtick.
Read Ethereum’s [ETH] Price Prediction 2024-25
The king of altcoins was resting under its 20-day Simple Moving Average (SMA) at press time, indicating a further price decline.
ETH’s price had touched the lower limit of the Bollinger Bands, which can trigger a trend reversal.

Source: TradingView


