
Ethereum struggled to touch the $4000 mark and was consolidating with an increase of 0.9%. Some altcoins, however, started to decline owing to longer periods of trading sideways. For instance, DOT moved nearer to the price floor of $$28.94.
Chainlink, too flashed range-restricted price action and was trading close to an immediate support level of $30.37 with chances of falling near its one-week low price level at $24.30.
Ethereum (ETH)
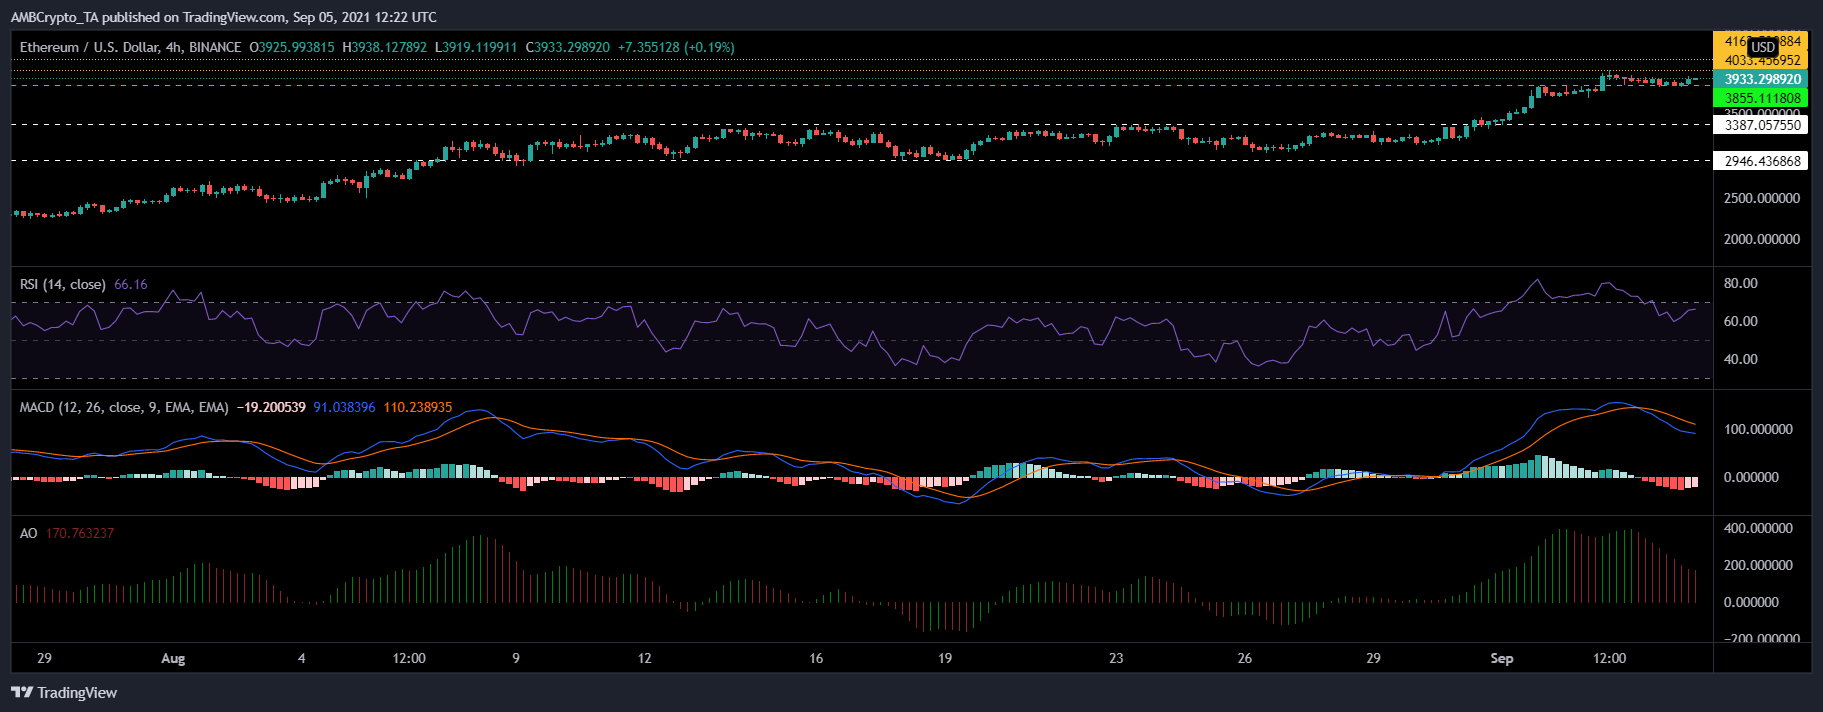
ETH/USD, TradingViewEthereum’s price action has been consolidating with minor gains of 0.9% over the last 24 hours. It was priced at $3933.29. It toppled over its price ceiling of $3855.11, and a break from the consolidation could push Ethereum to revisit the multi-month high of $4033.47.
Technical indicators, however, pointed that bearish price movement hadn’t fizzled out completely yet. Relative Strength Index was positioned above the 60-mark as buying strength remained bullish. MACD flashed red bars on its histogram.
Awesome Oscillator flashed red signal bars indicating negative price action. If the bearish perspective holds true, Ethereum would dip below $3855.11 and trade near $3387.08. Failing to remain above the $3387.08 price level would push ETH to its one week low of $2946.43.
In other news, Twitter could possibly allow Bitcoin and Ethereum to enable receiving tips through Tip Jar feature.
Polkadot (DOT)
DOT/USD, TradingView
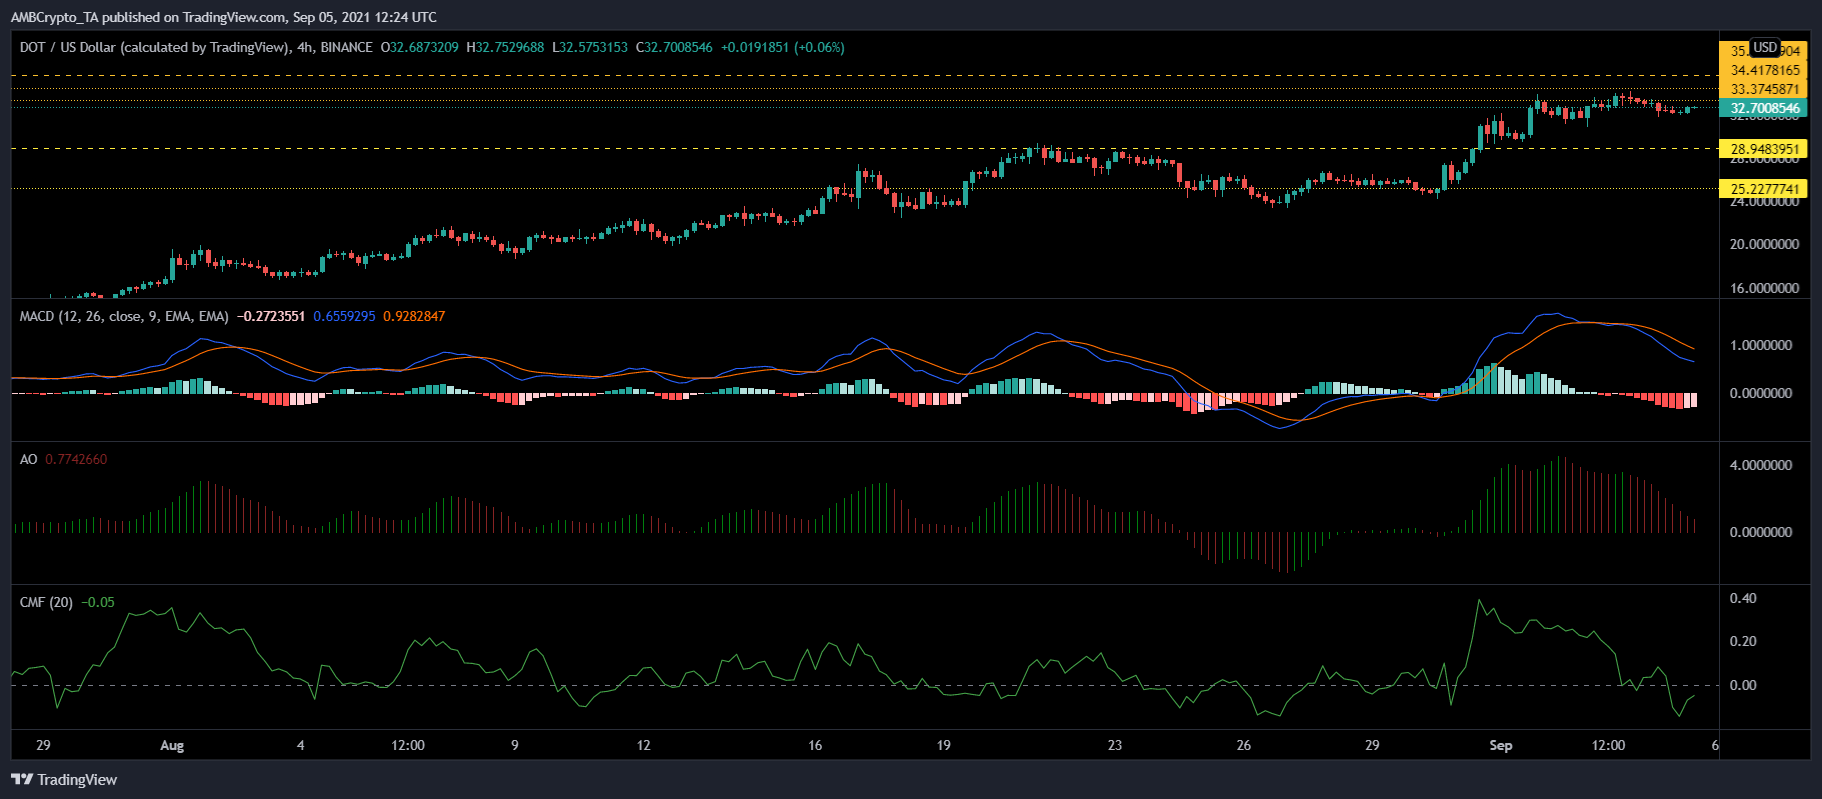
DOT traded in a range-bound manner and dipped by 0.8%. It was trading at $32.70. The altcoin stood notches below its weekly high of $33.37. If DOT’s price action remains consolidated over upcoming trading sessions, chances are that the altcoin could dip to $28.94.
Failing to sustain at $28.94, could drop DOT to a four week low of $25.22. The technical indicators appeared bearish for the coin. MACD underwent a bearish crossover and displayed red bars on its histogram.
Awesome Oscillator flashed red signal bars. Capital inflows dipped as the Chaikin Money Flow parked below the mid-line. If DOT reversed its price action on the upside, the overhead resistance was at $33.37, toppling it, DOT could aim for $34.41.
Chainlink (LINK)
LINK/USD, TradingView
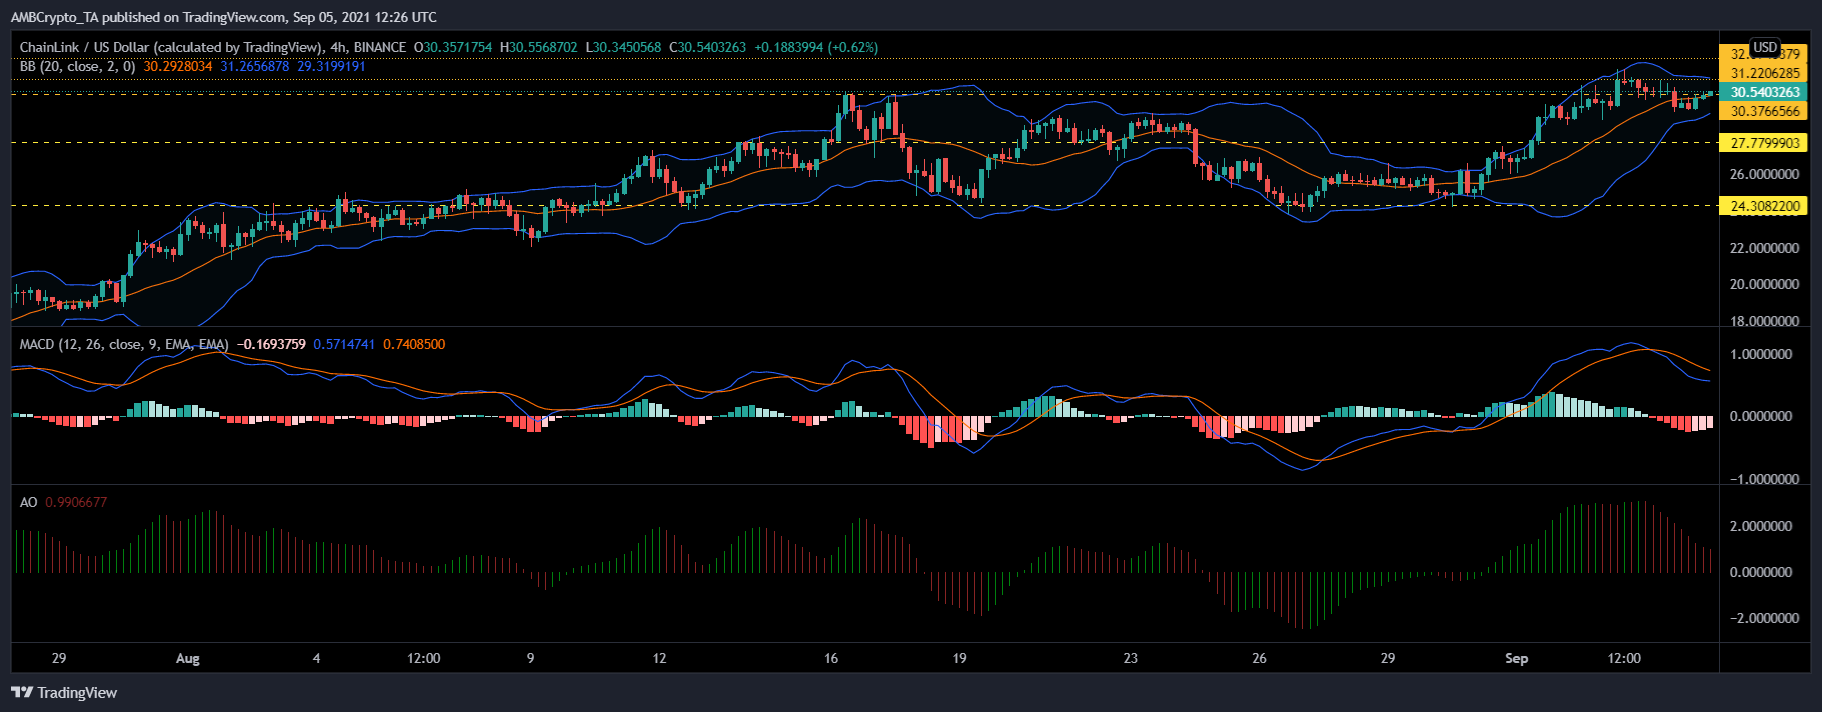
LINK fell by 0.2% while consolidating over the last 24 hours. The asset was priced at $30.54 and with a continued downtrend, LINK might fall to $30.37 and then to $27.77. If LINK is unable to hold its prices above $27.77, it might trade near its weekly low of $24.30.
Key indicators signified a negative price action. MACD displayed red bars on its histogram. Awesome Oscillator also flashed red signal bars.
Bollinger Bands remained tight, which means that price volatility would remain low over upcoming trading sessions. On the reverse side, LINK could find resistance at its three-month high of $31.22 and the attempt to retest the $32.22 price level.
With regards to recent developments, Bored Ape Yacht Club initiated an adoption with Chainlink’s Verifiable Random Function (VRF) to provide airdrops on the platform. This integration could lead to the increased interest of investors.