Ethereum Price Analysis: 03 June

Disclaimer: The findings of the following article are the sole opinions of the writer and should not be taken as investment advice
An upwards trend had hit the cryptocurrency market, at press time, and most cryptos were seeing the formation of a lasting bullish trend. Ethereum, the leader of altcoins, has also been seeing a strong surge in price, with the crypto’s long-term chart reflecting a holding trend.
Ethereum daily chart
Ethereum’s price has been moving along a crucial path as it chooses its way forward. At the time of writing, there were two scenarios in play – One which could push the asset towards consolidation and the other which could fuel a strong surge in the crypto’s price.
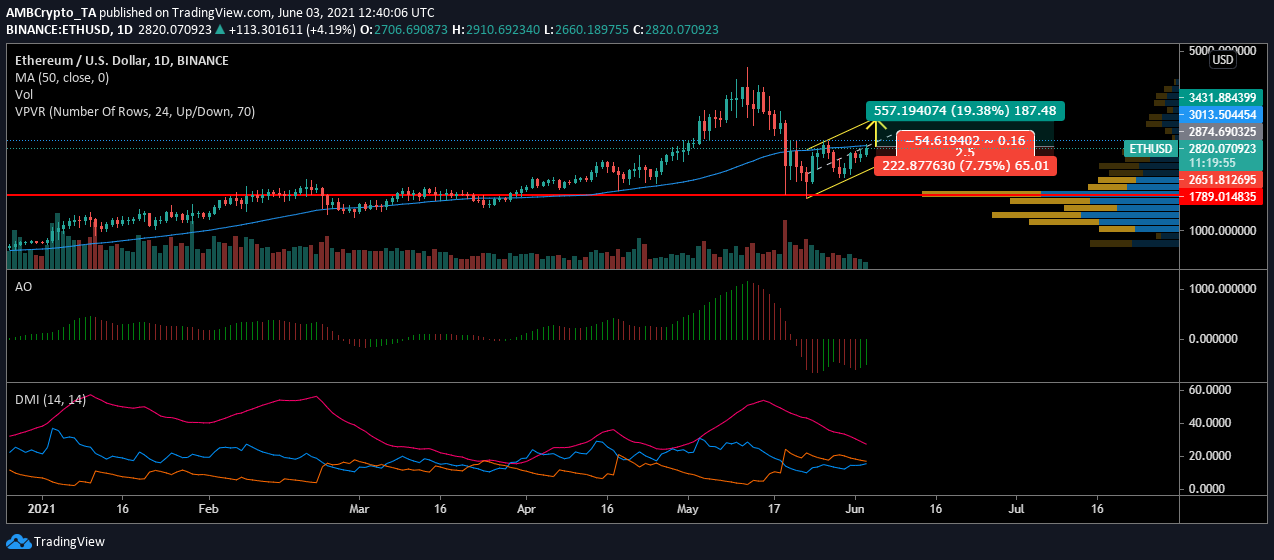
ETH’s daily chart pictured the alt’s price gliding under the immediate resistance of $3,013. As ETH last exchanged hands at $2,820, the crypto-asset seemed to be northbound. If ETH can successfully breach $2,836, it would set a new higher high, forming an ascending channel. However, if it fails to hit the resistance level, it may move sideways.
Reasoning
The 50 Moving Average was observed to have been parallel with the crypto’s price. Its press time value was coinciding with the MA. If the price crosses above the MA, it may see an upwards surge. Here, ut’s worth noting, however, that despite the value growth, volume has not been increasing.
The attached chart also pictured a downtrend in volume as the price trended higher. The Visible Range Indicator also affirmed that the said price level was not seeing much trading activity as the histogram plotted remained low. The low volume and trading at this price level suggested that a downtrend could be possible in the short term.
However, momentum was building up in the long term, especially since upwards pressure was hinted at by the Directional Movement Index. The -DI was heading to cross under the +DI. This was an important sign as -DI had remained dominant ever since ETH started to recover from the fall on 19 May. This could pave way for the price to appreciate.
If ETH surpasses the aformentioned resistance,
Entry-level: $3,051
Take Profit: $3,431.88
Stop-level: $2,834
Risk and Reward: 1.75
Conclusion
Ethereum’s market was in a conundrum, at press time, as the price could either surge or consolidate. The market’s volatility added to the value of the digital asset, but the volume has not been supporting the price. As the price moves towards its resistance level, the market will decide between a surge and a possible correction.