Analysis
Ethereum Price Analysis: Cryptocurrency seems to be settling in the bearish realm
Ethereum, the second-largest cryptocurrency by market cap, seems to be headed towards recovery from the slump it witnessed last week. At press time, similar to other cryptocurrencies, the price of ETH was surging by 0.31% over the last 24-hours while its price stood at $181.30.

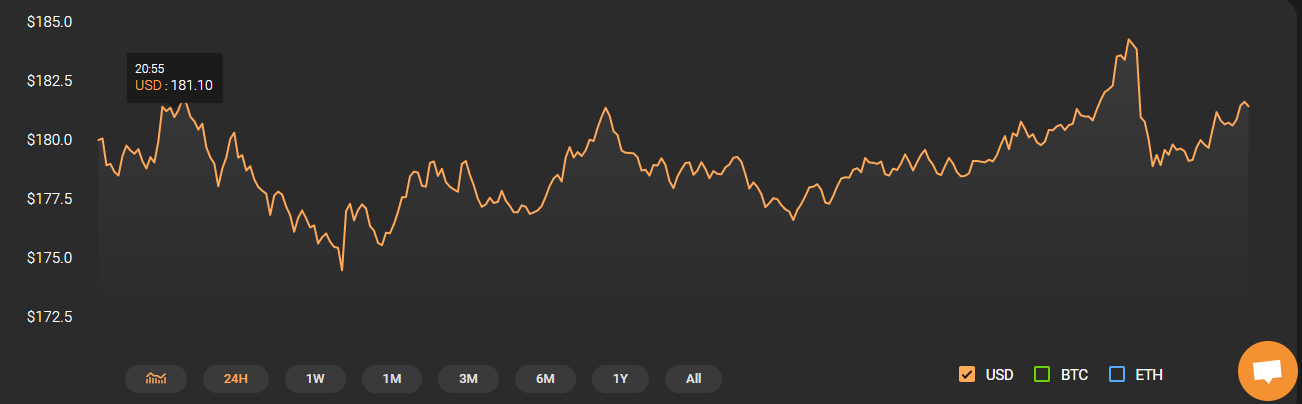
Source – Coinstats
Ethereum 1-hour chart

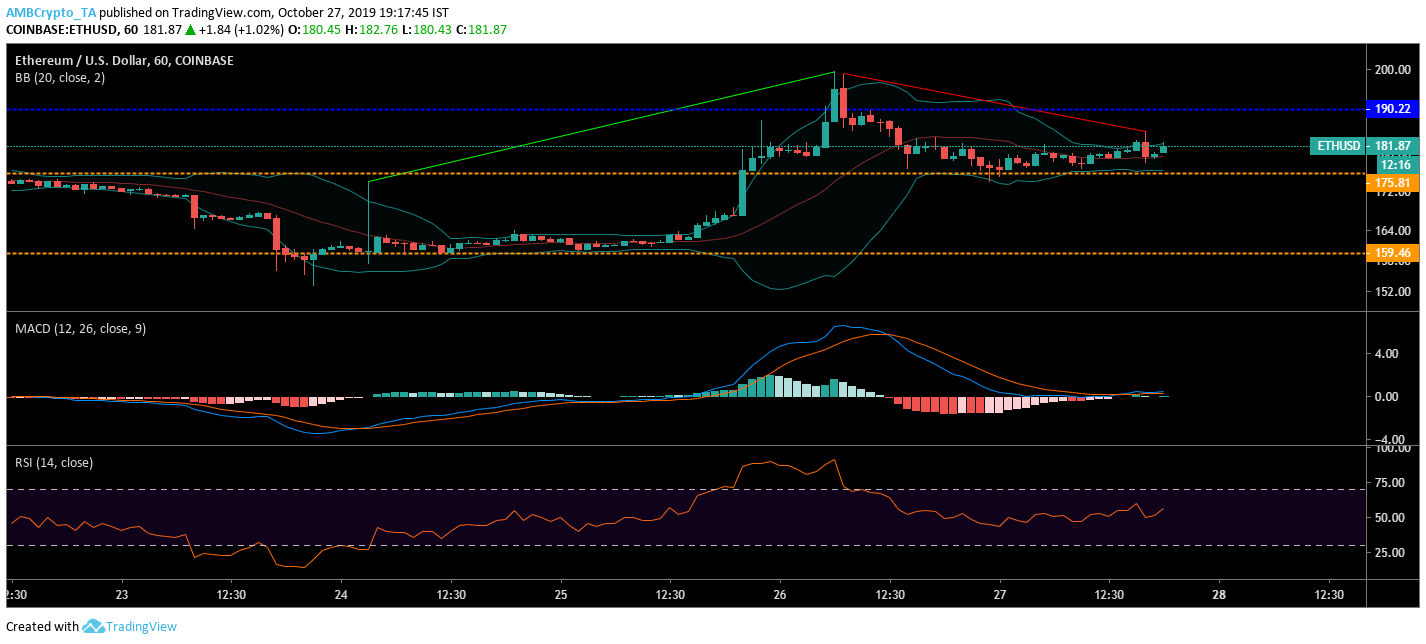
Source – ETH/USD on Trading View
An uptrend was formed from $174.64 to $199.19 in the one hour chart of ETH, along with recording a downtrend starting from $198.95 till $185.33. A resistance was formed at $190.22 accompanied by two supports at $175.81 and $159.46.
Bollinger Bands indicated the price volatility was seen diverging, further revealing low volatility in the ETH market.
MACD, another key indicator, hinted the presence of bulls in the market as the MACD line was seen sluggishly surpassing the signal line.
Relative Strength Index aka RSI also seemed to side bulls as the RSI line was above the 50 median at 56.83.
Ethereum 1-day chart

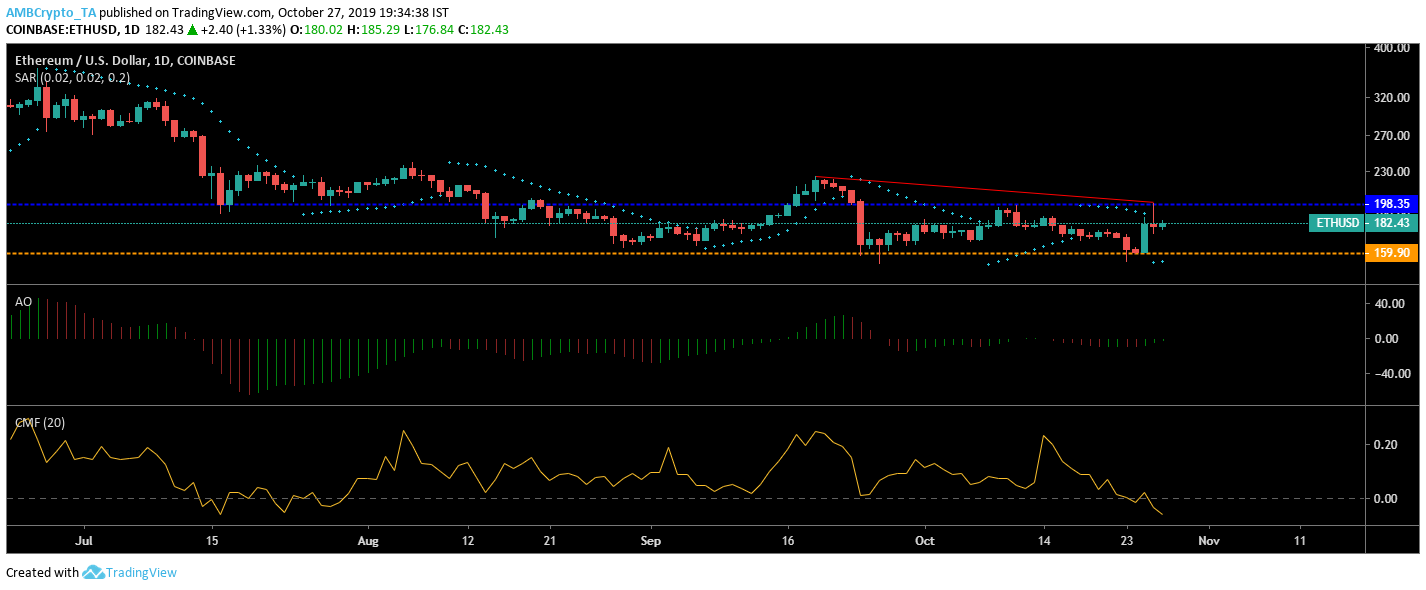
Source – ETH/USD on Trading View
The one day chart for Ethereum formed a downtrend from $225.12, extending to $199.68. ETH witnessed support at $159.90 and resistance at $198.35.
Parabolic SAR indicator revealed the presence of bears in the market as the indicator was below the candlesticks.
Awesome Oscillator revealed low market momentum, however, the formation of green bars spun a different story by indicating a bullish market.
The Chaikin Money Flow aka CMF indicated that the capital flowing into the market was low as the marker was in the oversold zone.
Conclusion
The aforementioned indicators for the one hour as well as the one day chart indicated the strong presence of bears in the market.