
- Ethereum was trading at a key resistance zone.
- An impulse move higher is anticipated, but traders should be wary of a breakout.
Ethereum [ETH] was laboring in a long-term downtrend. The price has been stuck in the $2550-$2730 zone for nearly two weeks now. The long-term downtrend and the bull vs bear case were examined in detail in a recent AMBCrypto report.
An investigation revealed that Ethereum users were increasingly opting for private transactions which consume more gas. This added to the volatility to the base fee and could disadvantage network users.
Is this an accumulation phase before the next bullish expansion?
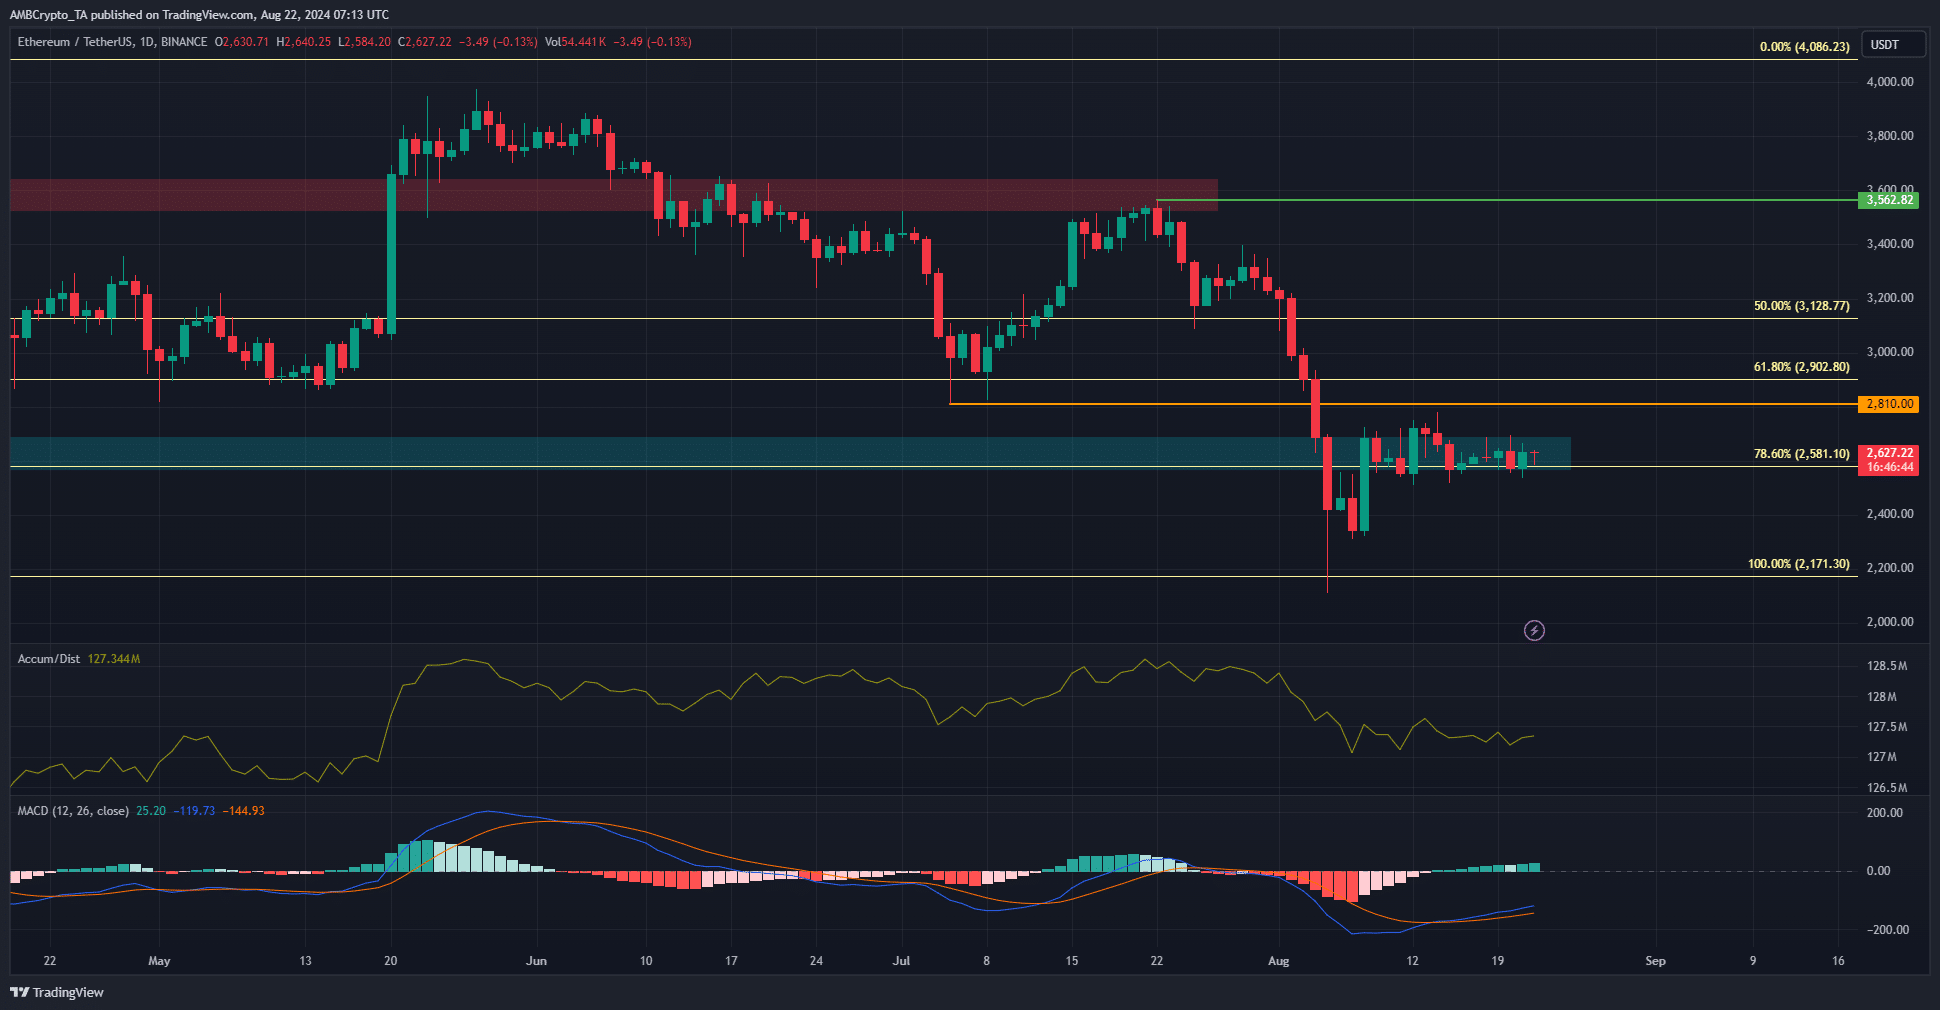
Source: ETH/USDT on TradingView
The market structure on the daily timeframe was still bearish. The price constriction around $2.6k over the past two weeks could be paving the way for a sharp move upward. This is because the slump in early August left behind some imbalances on the chart.
Yet, even if ETH rallies to $3k, it might not be enough to initiate a breakout. The A/D indicator showed bulls were indifferent during the recent consolidation and lacked the strength to push prices higher.
Hence, a move upward would be driven by liquidity and not demand and might be reversed thereafter.
Spot demand makes a case for a bearish short-term ETH price prediction
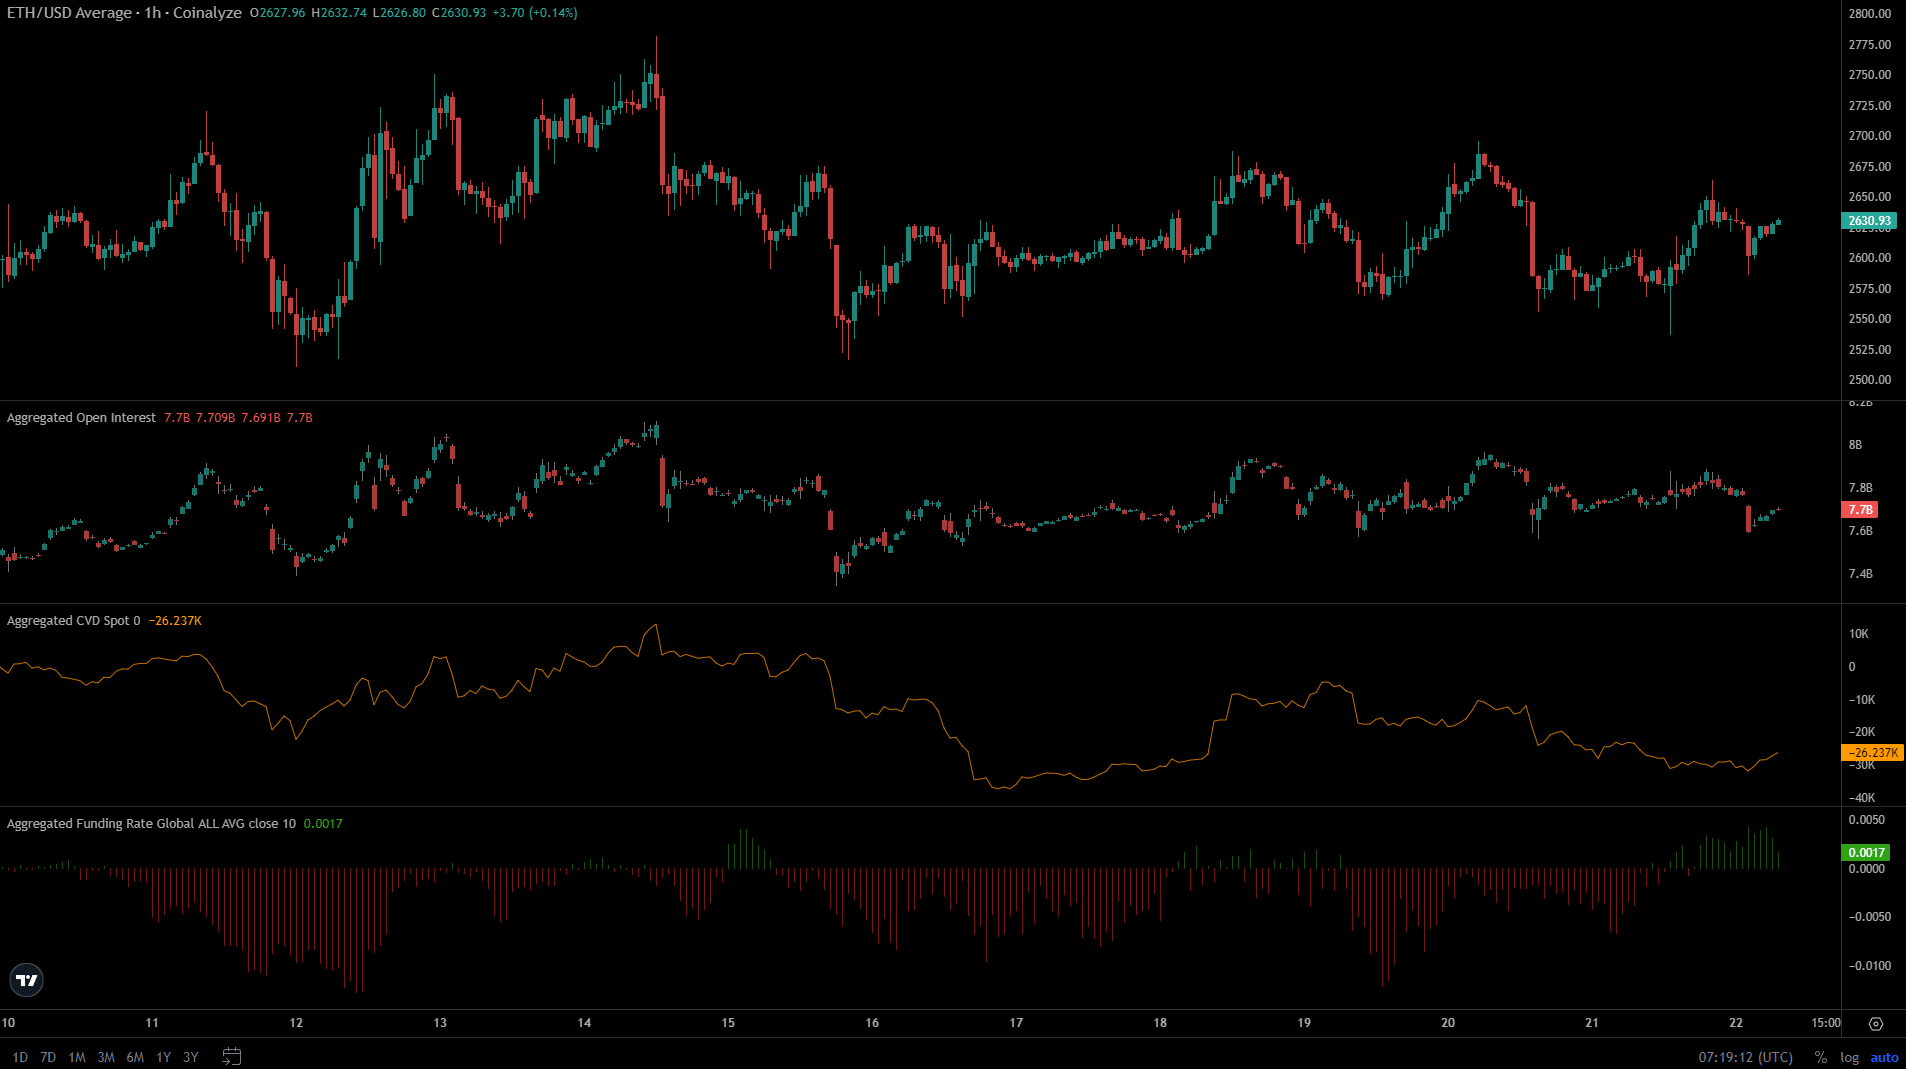
Source: Coinalyze
On the lower timeframes, the Open Interest behind Ethereum has been fluctuating alongside the price since the 18th of August. It outlined a lack of conviction in the futures market.
The funding rate, which had been negative, climbed into positive territory. This was a sign that speculators were going long, but it was not a strong bullish sign.
On the other hand the decline in the spot CVD was a bearish signal that reinforced the lack of demand behind ETH.
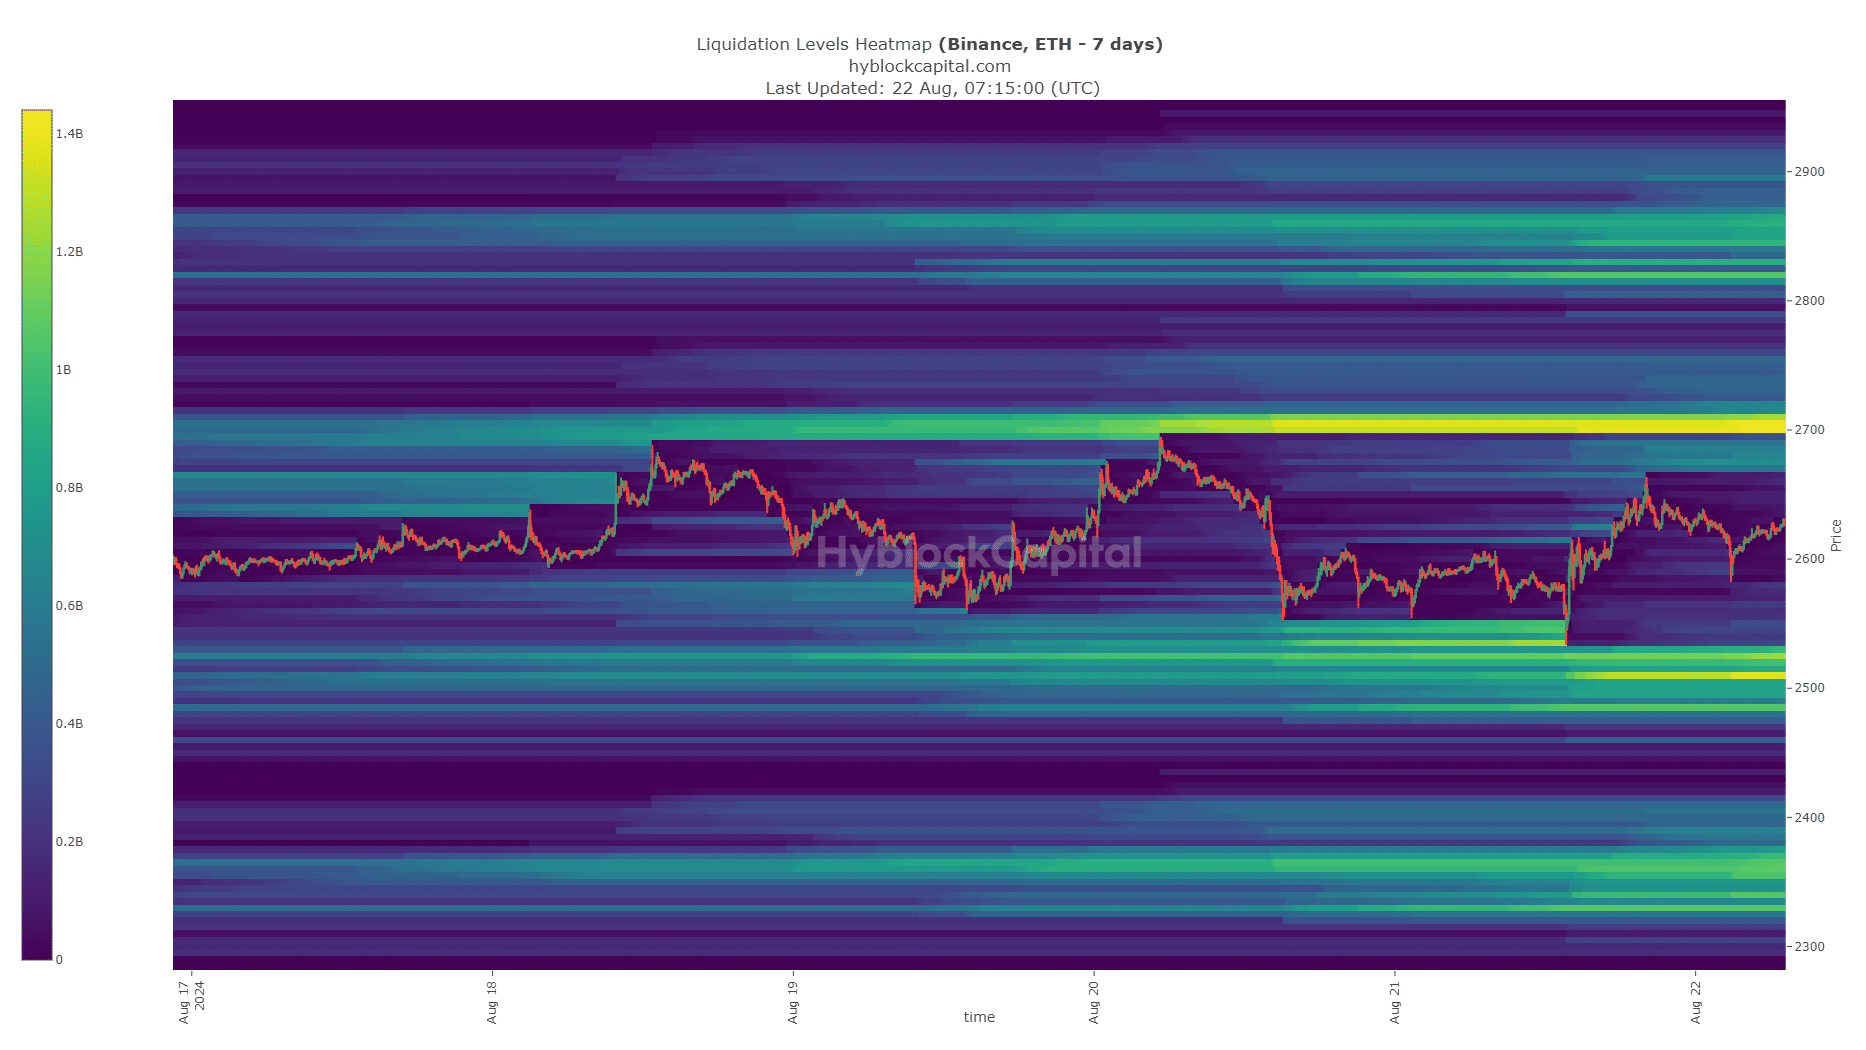
Source: Hyblock
The liquidation heatmap highlighted $2.7k and $2.5k as the short-term price targets. As things stand, a move toward $2.7k appeared highly likely in the coming days.
Therefore, the short-term Ethereum price prediction is bullish, and a move toward $2850 was also possible.
Is your portfolio green? Check the Ethereum Profit Calculator
Such a move would be driven by the magnetic zone and would likely reverse. Hence traders can wait for opportunities to sell the bounce rather than buy ETH near the $2.9k-$3k resistance zone.
Disclaimer: The information presented does not constitute financial, investment, trading, or other types of advice and is solely the writer’s opinion