Ethereum, SAND, ApeCoin Price Analysis: 23 March

Ethereum made a solid comeback during the previous week, while SAND followed suit. On the other hand, the newly released ApeCoin has everyone’s attention as it enjoyed considerable buying strength.
Ethereum (ETH)
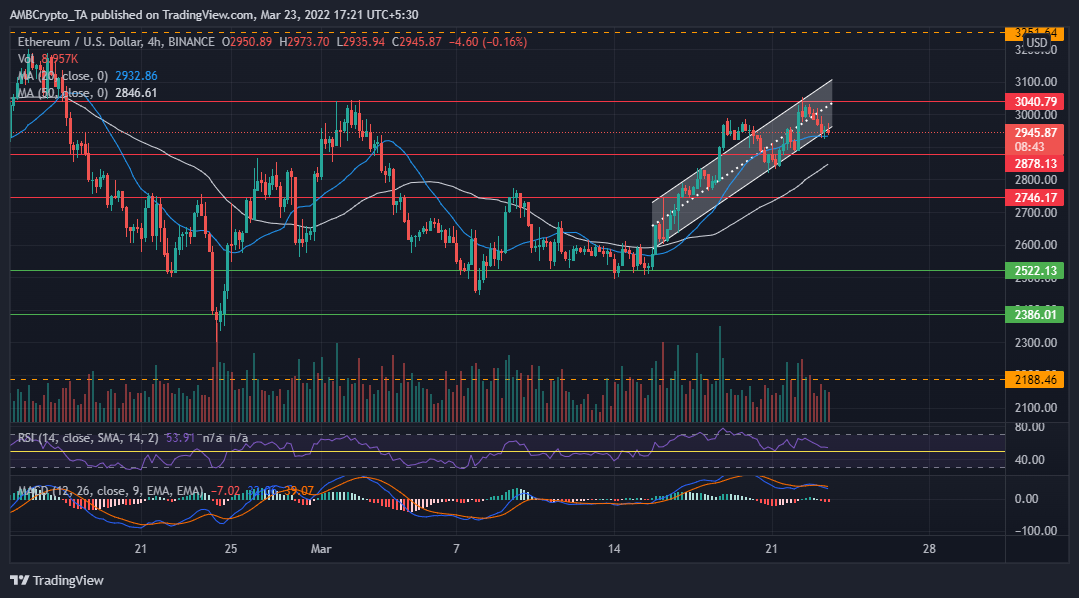
Ethereum (ETH) bounced back from the $2522 support on 15 March and recorded steady gains over the previous week. The alt has marked consecutive higher lows since then, recording a 9.5% growth during the last week. Earlier, the coin traded sideways since 5 March between $2522 and $2746 zone.
Owing to strong support from the buyers, the coin went up the chart. It even hit a resistance at $3040 level the previous day. However, the price fell by 2.15% over the previous day and ETH could soon be retesting support at $2878.13 level. The RSI hovered at 54.52, indicating a minor dip since the previous day, while the MACD hinted at a bearish crossover above the zero line. ETH prices may drop a little more in the days to come.
The Sandbox (SAND)
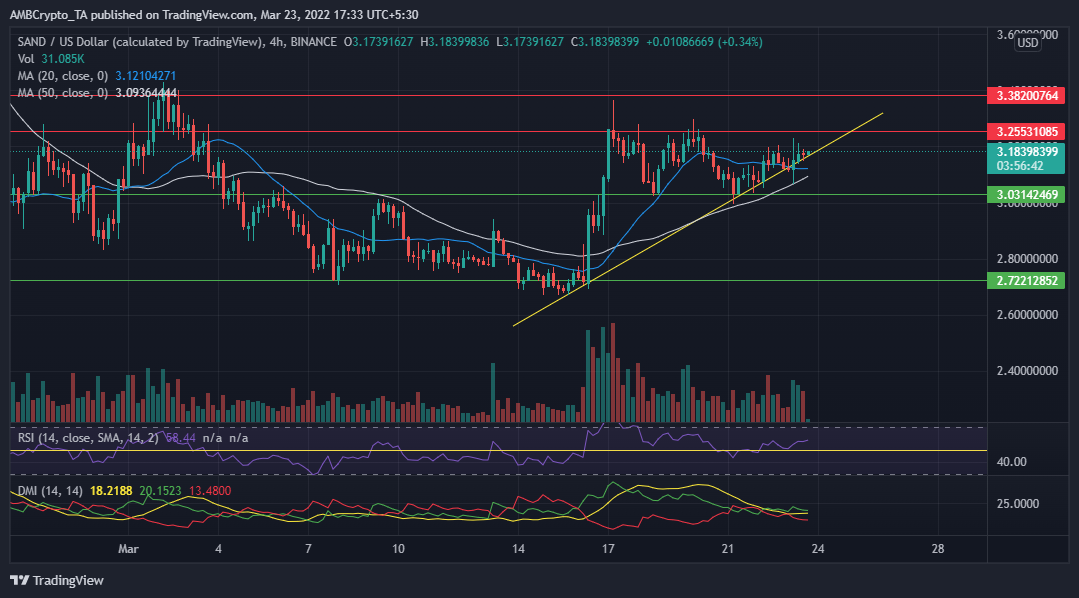
The Sandbox (SAND) made a notable recovery since 16 March as the coin bounced from the $2.72 support level to hit resistance at $3.25. Ever since 17 March, the coin has been trading sideways between the $3.03 and $3.25 mark. SAND was able to maintain higher lows.
The alt gained 7.89% over the previous week and during press time, it traded for $3.16, gaining 1.5% over the previous day. The RSI hovered at a solid 55.98 while the DMI indicated a bullish crossover. It is expected that the alt may hit the resistance at $3.25 once again in the days to come, and might as well breach it if the buyers showed support.
ApeCoin (APE)
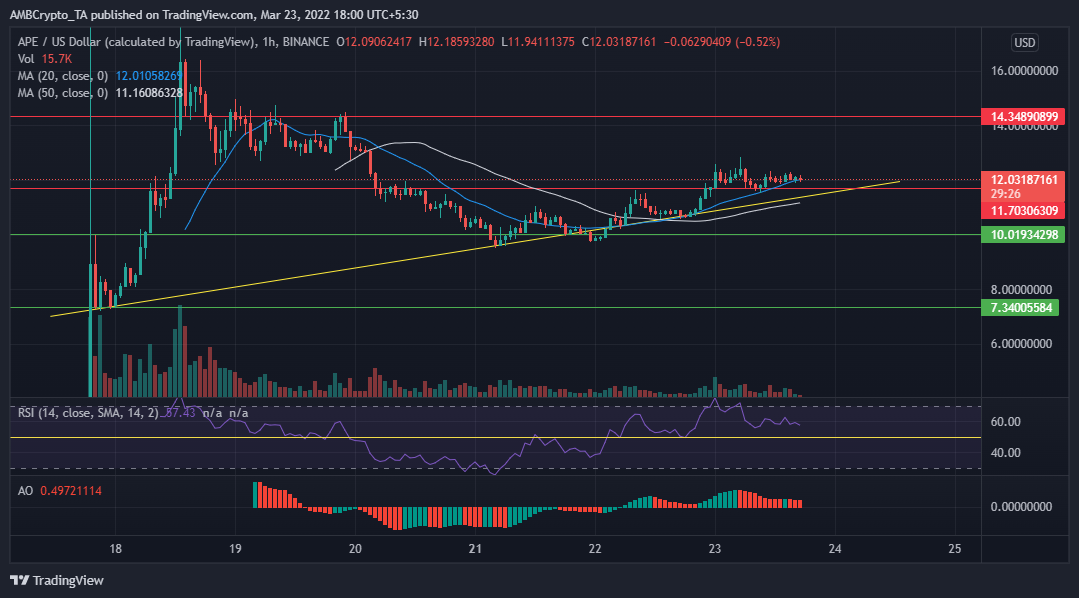
ApeCoin (APE) which was released on 17 March has seen quite a lot of trading volumes. The charts suggest that as soon as it was released, the buyers pushed the coin up the chart from $7.19 to hit resistance at $17.69 the very next day.
The alt dipped on 19 March and it found support at $10.01 level. During press time, the alt was trading at $12.03 and was likely to retest support at $11.70 level. The RSI stood relatively strong at 58.25, even though it seemed to be dipping gradually. Even the AO was above the zero line, but gradually turning red and narrow.


