


- Ethereum’s active deposits spiked to a record high since March, recording over 17,000 deposits.
- Its exchange netflow still, however, showed dominant negative outflow.
Ethereum’s price has been experiencing notable fluctuations of late, and according to Santiment’s recent deposit metric, there could be even more volatility on the horizon as the weekend approaches. However, by examining Ethereum’s Netflow, we may better understand the prevailing sentiment, overriding the impact of these price swings.
Realistic or not, here’s ETH’s market cap in BTC terms
Ethereum active deposits spike
Ethereum marked a significant surge on 9 June in some key metrics, as observed on Santiment.
According to Santiment, the active and deposit transaction metrics experienced a notable spike leading up to the weekend. The active deposits metric reached an impressive figure of over 17,500, while the deposit transactions metric surged past 17,700.
Notably, active deposit addresses have reached their highest level since March, suggesting the potential for increased volatility.

Furthermore, it is important to note that active deposits encompass both incoming and outgoing transactions, including transfers from personal wallets to deposit addresses and from deposit addresses to main exchange wallets. Therefore, examining the spike in these metrics might not provide a conclusive assessment, as it merely indicates a surge in participant activity.
To obtain a more comprehensive understanding, delving into another crucial Ethereum metric might offer a clearer depiction of the situation.
Ethereum exchange netflow
According to the Santiment chart, there has been a notable trend of Ethereum exiting exchanges, resulting in a decrease in the volume held on exchanges. As of this writing, the supply of Ethereum on exchanges decreased to 9.45% of the total supply.

Additionally, analyzing the exchange netflow data from CryptoQuant revealed that the flow in the past few days were predominantly outward transfers from exchanges. As of this writing, a significant negative netflow of approximately 30,000 Ethereum was recorded.
This indicated a higher inclination toward accumulation and a reduced risk of sell-offs. While this could be interpreted as a bullish sign, it also implied the potential for impending volatility.
ETH price trend and volatility
At the time of writing, Ethereum was undergoing a notable downward trend in price when observed on a daily timeframe chart. It was trading at approximately $1,740, reflecting a decline of over 5%.
The Bollinger Band analysis indicated that ETH was currently experiencing a certain level of volatility, although the band’s elasticity suggested that the current volatility was relatively minimal.
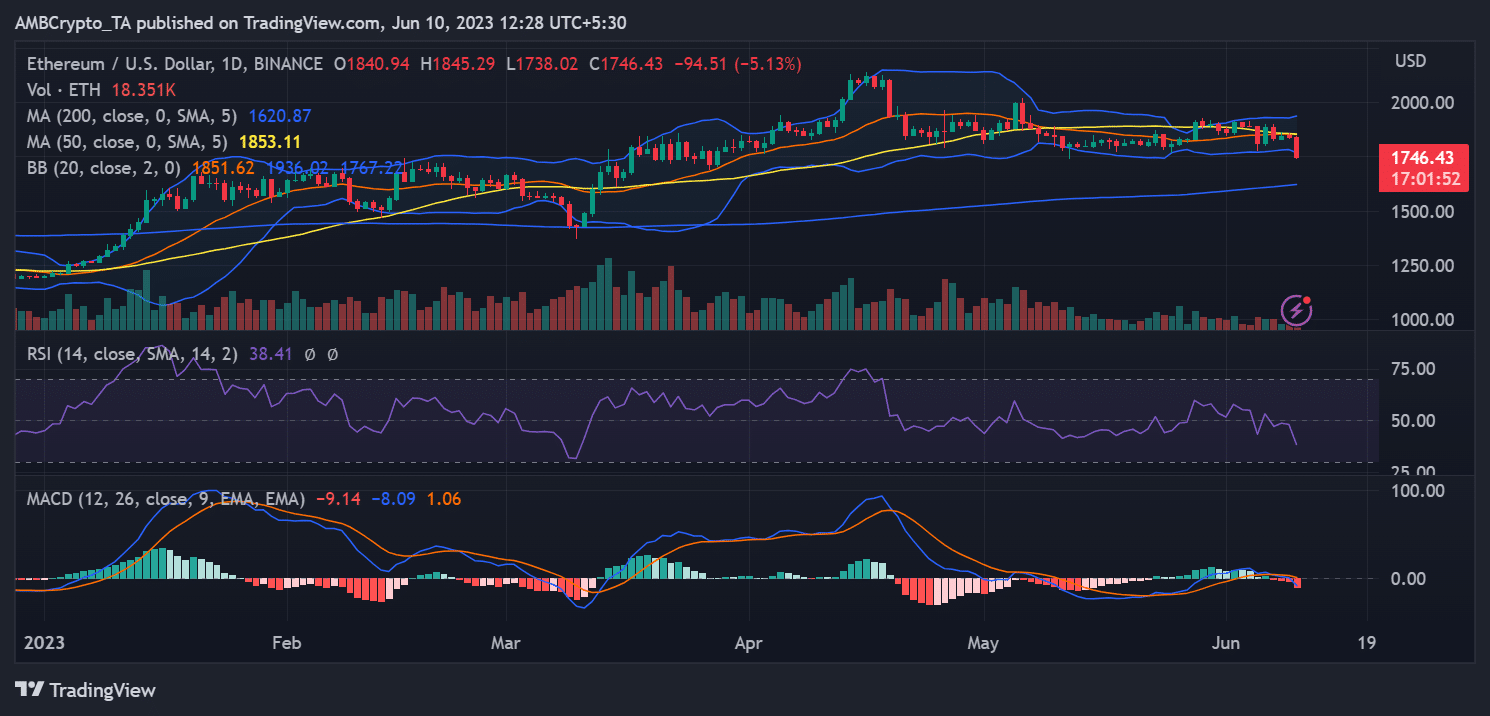
How much are 1,10,100 ETHs worth today
Furthermore, the recent decline caused ETH’s Relative Strength Index (RSI) to drop below 40, indicating a stronger bearish trend in the market. Moreover, according to the volatility metric provided by Santiment, the current volatility level of Ethereum stood at 0.01% as of this writing.