Ethereum, Shiba Inu, Algorand Price Analysis: 19 December

While the Bitcoin fear and greed index saw a 6 point surge in 2 days, the bulls gained some motion as Bitcoin and Ethereum were up by more than 2.5% over the past 24-hours.
However, Shiba Inu bulls struggled to trigger an uptrend after the bears breached the 61.8% Fibonacci support.
Ethereum (ETH)
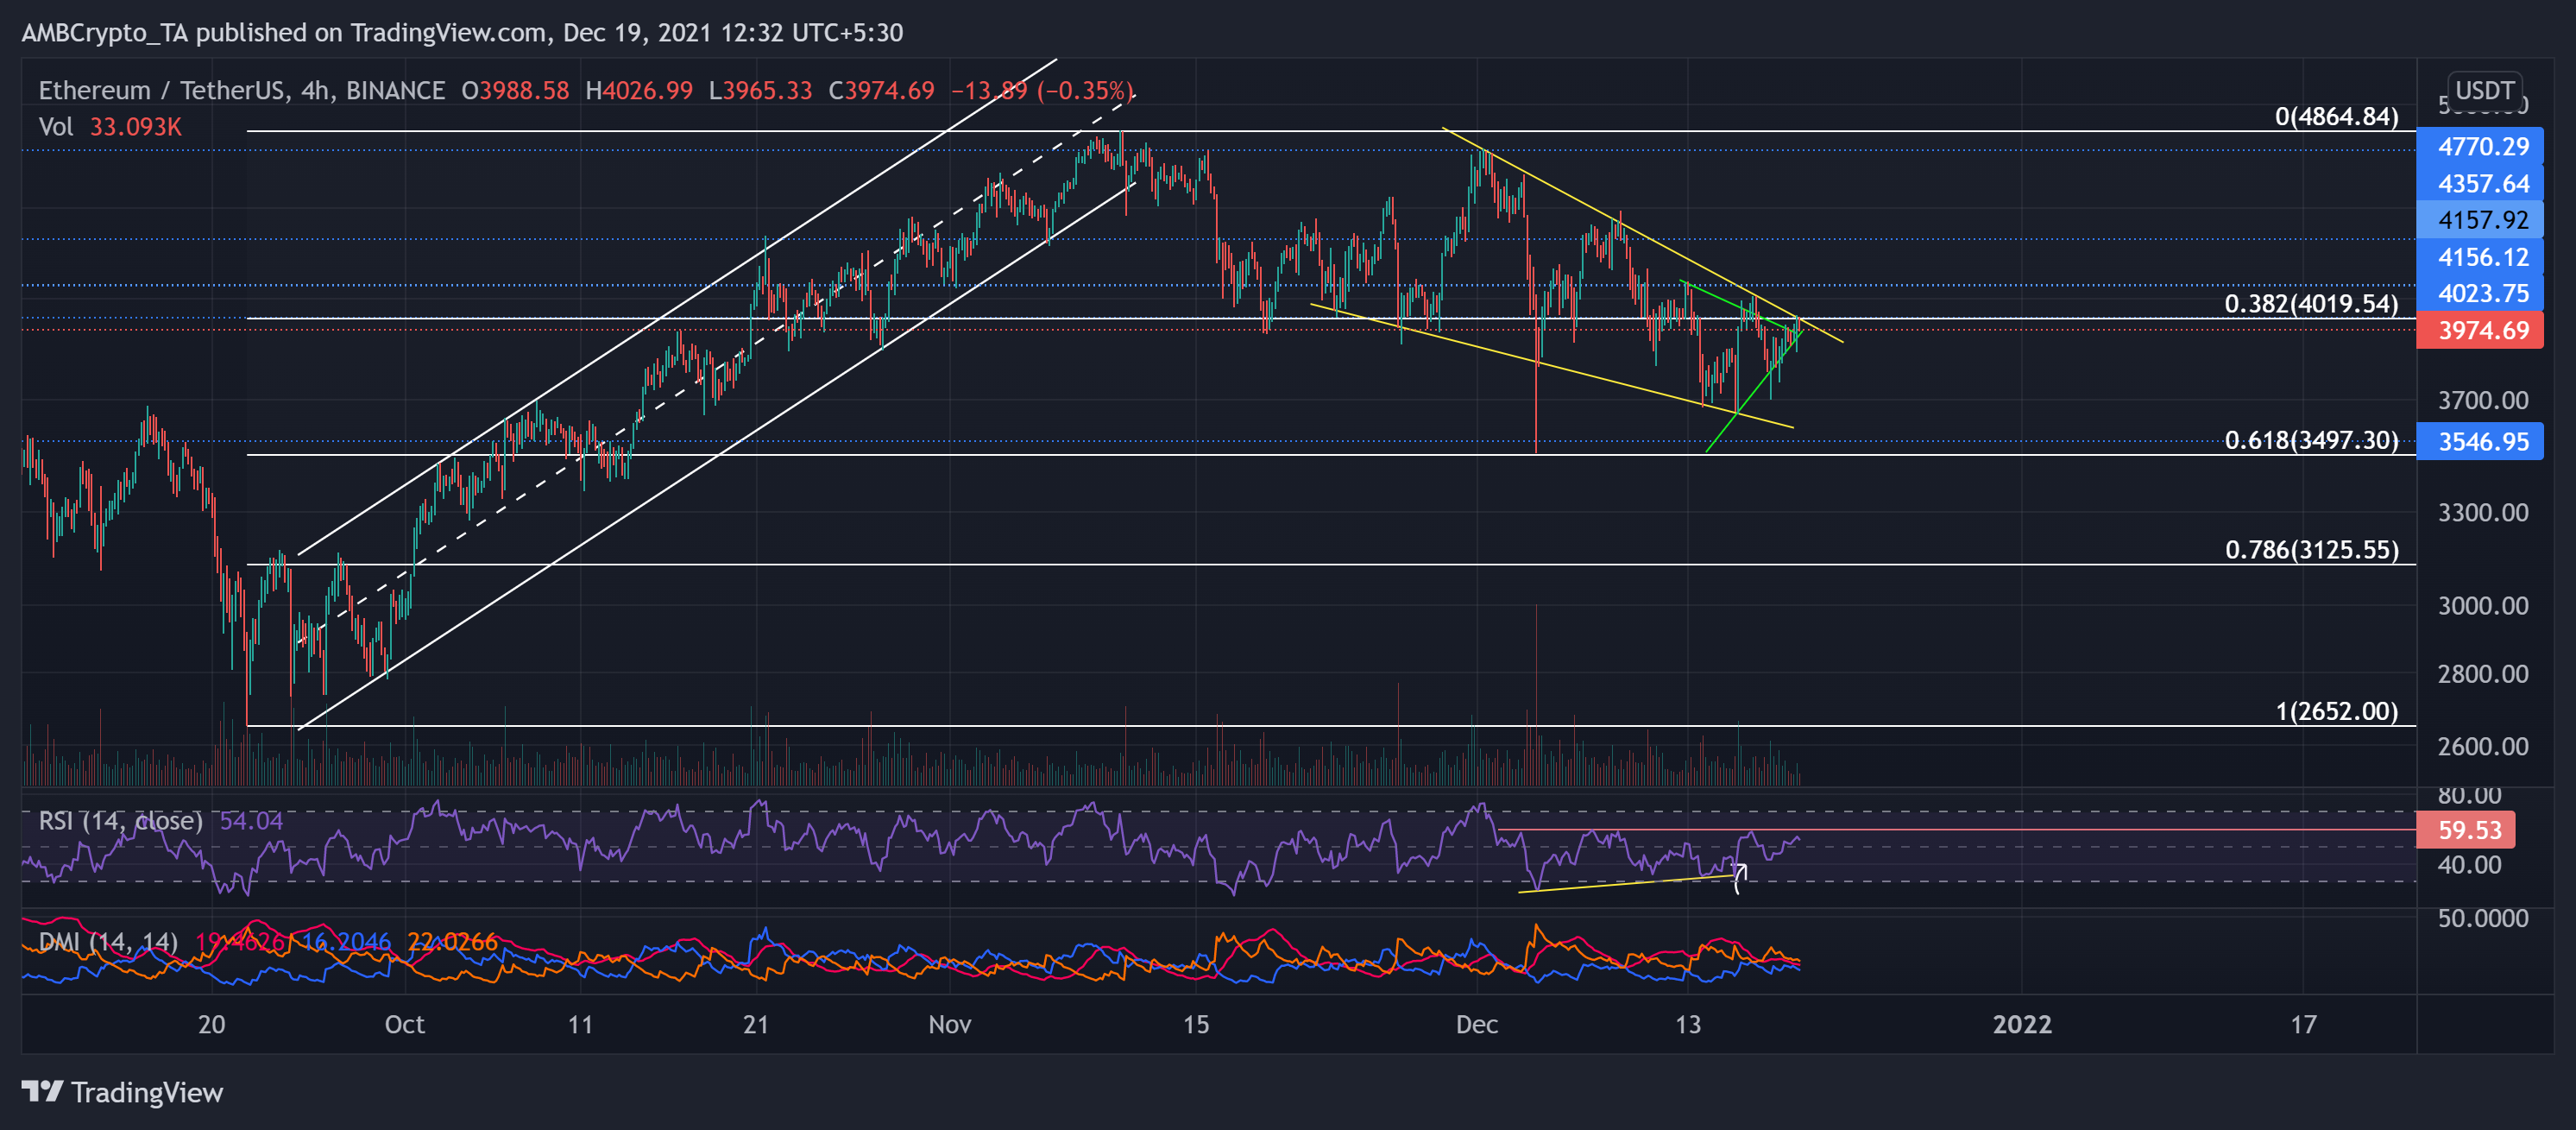
On its 4-hour chart, ETH formed a long-term reversal pattern by witnessing a falling wedge over the past month. However, it saw a symmetrical triangle (green) in the last seven days.
After testing it multiple times, the bears finally breached the 38.2% Fibonacci (previous support) to poke $3,503. But the price action bounced back from the 61.8% Fibonacci support.
ETh saw a decent 9.07% recovery over the past three days in anticipation of a bullish divergence that occurred between the RSI and the price action (yellow trendline). But this rally was halted at the $4,000-level as the bulls test that level for the second time now.
ETH bulls will need to back their rallies up with increasing volumes to flip the $4,000-mark as support. The RSI found near-term resistance at the 59-mark while it headed toward the half-line. The DMI showed a bearish bias but could not flash a strong directional trend for ETH.
Shiba Inu (SHIB)
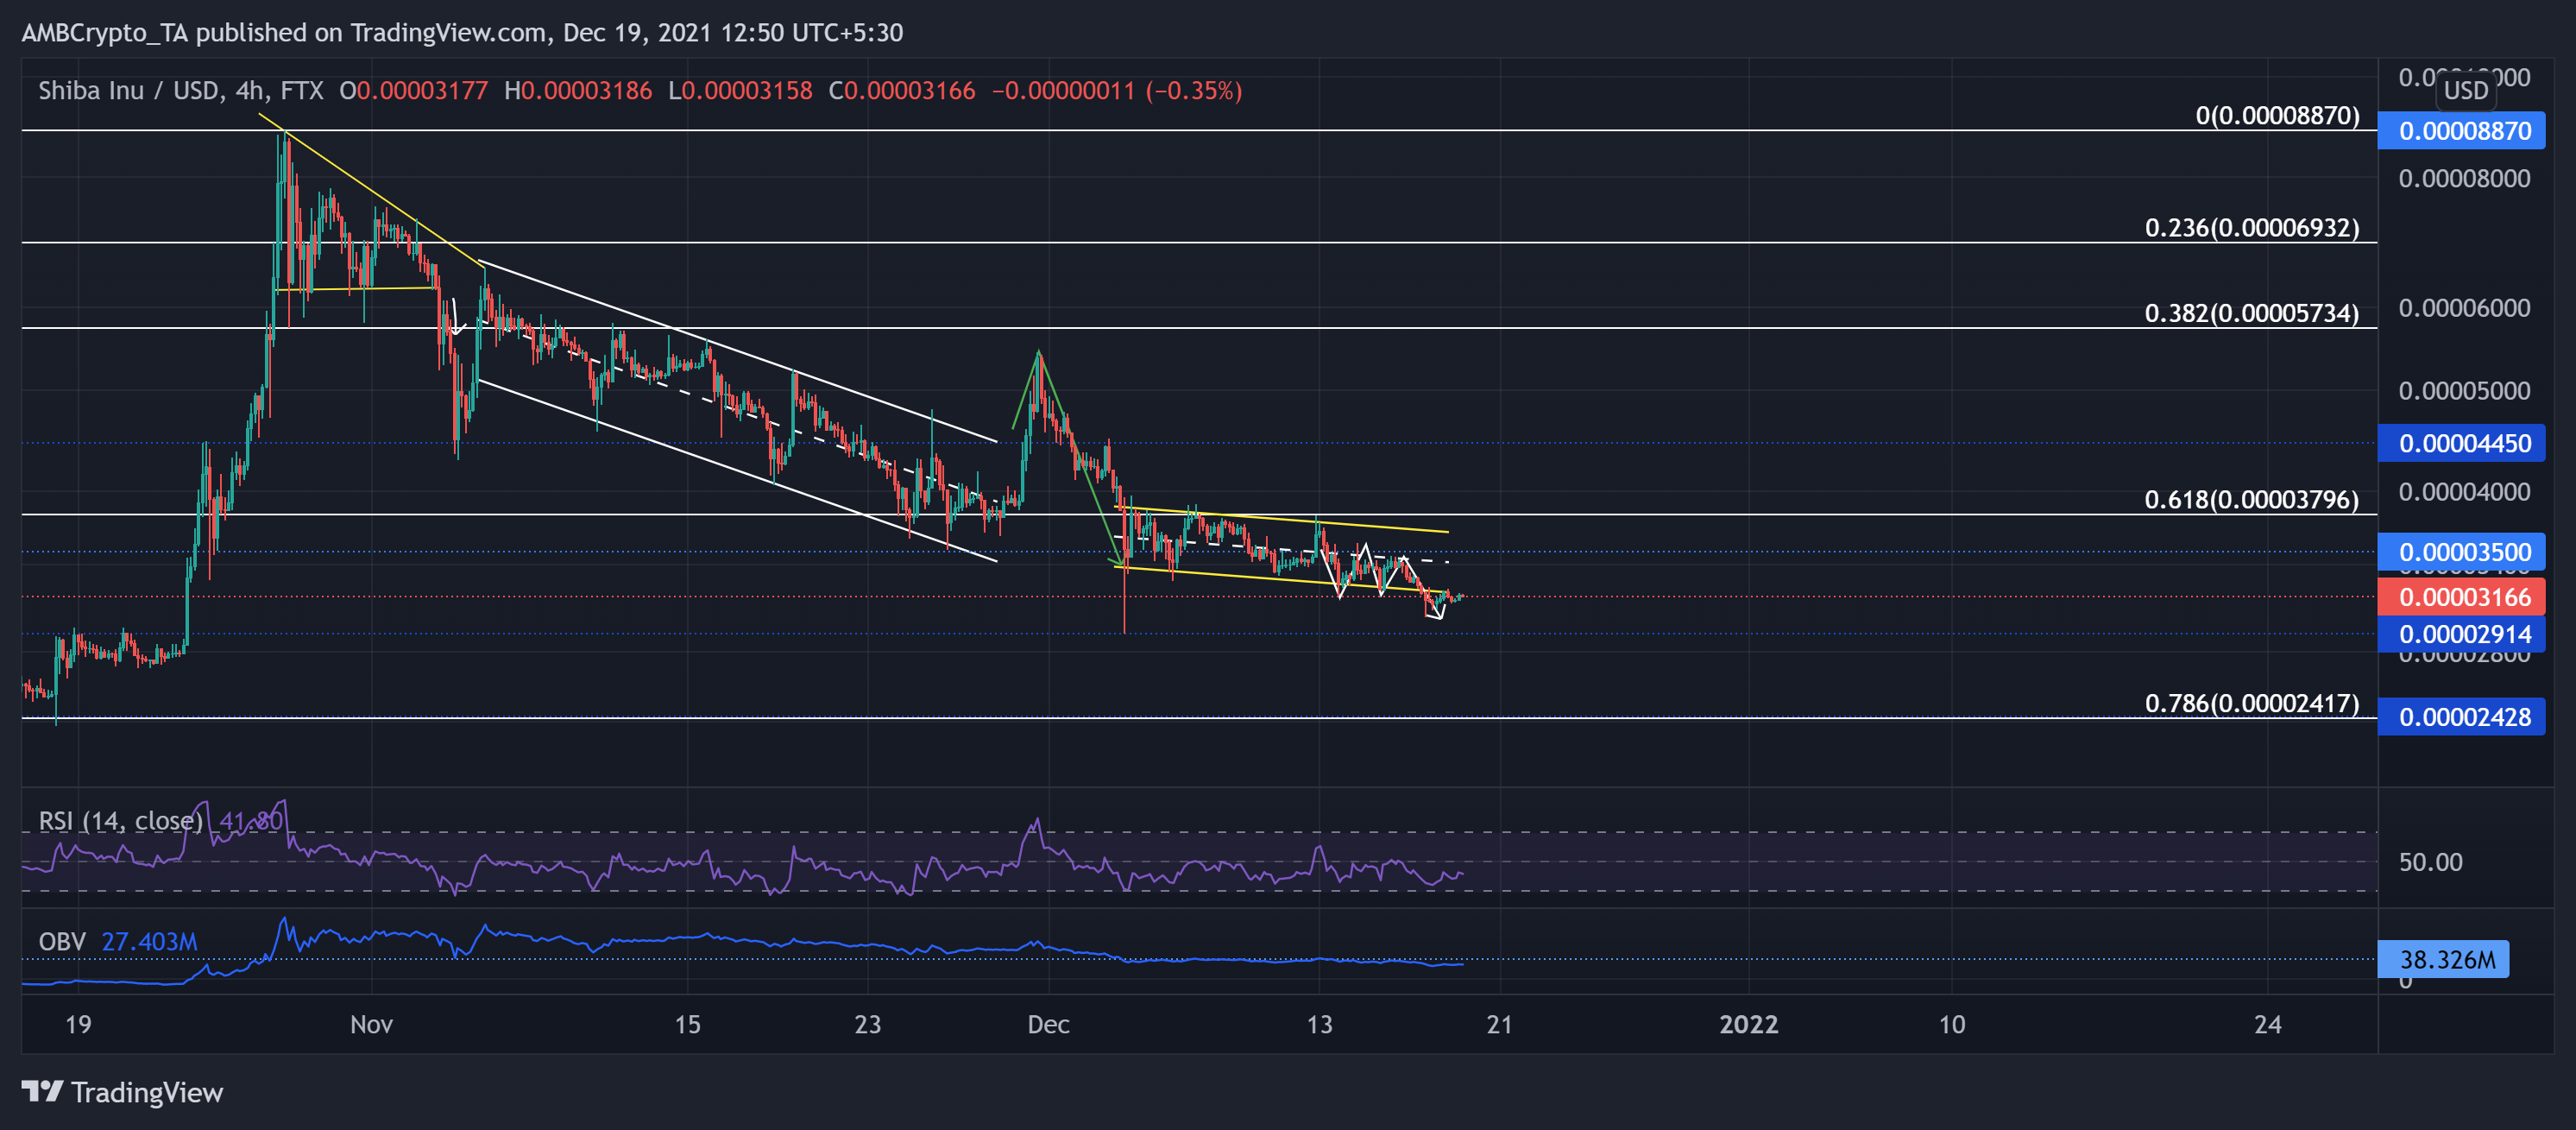
SHIB saw a breakdown from its V-top on 2 December and formed a descending channel (yellow) over the past 15 days. The alt witnessed an over 40.53% 18-day decline in its value.
This fall breached the golden 61.8% Fibonacci level while the bears also snapped the crucial $0.000035 resistance. Then, as the half-line (white, dashed) of the down-channel became an immediate hurdle, the bears tested the lower channel (yellow) thrice in the past six days.
At press time, SHIB traded at 63.3% below its ATH at $0.00003166. The RSI failed to sustain itself above the half-line throughout this month. Further, the OBV lost its previous long-term support.
Algorand (ALGO)

ALGO performed quite loosely after poking the $2.94-mark on 18 November. Then, the price action saw a substantial breakdown as it fell below the $1.84-mark. After forming an up-channel (white), the bulls snapped the aforementioned level but succumbed to a broader sell-off on 3 December.
As a result, after forming a bearish flag, it further broke down below the $1.59-mark (three-month resistance) in a down-channel (yellow).
However, At press time, ALGO traded at $1.3924 after registering a 2.6% 24-hour gain. Consequently, it saw a breakout above the upper channel. The RSI struggled to cross the half-line as flashed neutral signs. Despite the price action marking newer lows, the OBV seemed to find strong near-term support, indicating the possibility of stalling the sell-off.


![Aerodrome [AERO] had its moment](https://ambcrypto.com/wp-content/uploads/2026/06/Abdul-2026-06-22T084432.364-e1782114380197.webp)