Ethereum

Ethereum shows promise but faces THIS critical resistance zone – What’s next?
Posted:
Journalist

- Ethereum showed steady price action with strong support, whale activity, and cautious investor sentiment.
- Whale accumulation suggests potential for a breakout, but resistance around $2,250 remains a key hurdle.
Ethereum’s [ETH] recent price action has been steady, but far from uneventful. Beneath the surface, shifting investor behavior and notable on-chain movements are beginning to define the current market structure.
As ETH trades within a tight range, accumulation patterns, whale activity, and exchange flows suggest a market at an inflection point — raising questions about whether this signals quiet strength or just temporary stability.
Support builds, but confidence remains measured
Ethereum is sitting on a strong pocket of investor support between $1,886 and $1,944, where over 3 million addresses accumulated 6.12 million ETH.
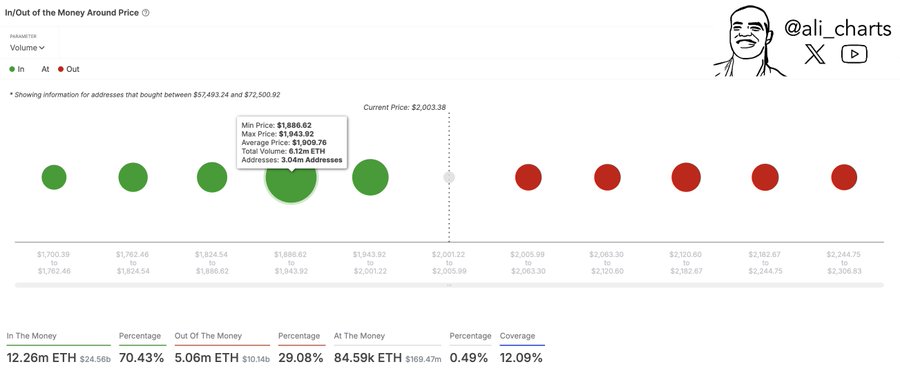
Source: X
This cluster now represents a key psychological and technical base — if ETH slips below, it could trigger broader selling.
On the supply side, over 1.20 million ETH has quietly moved off exchanges in the past 48 days, suggesting a drop in near-term selling pressure.
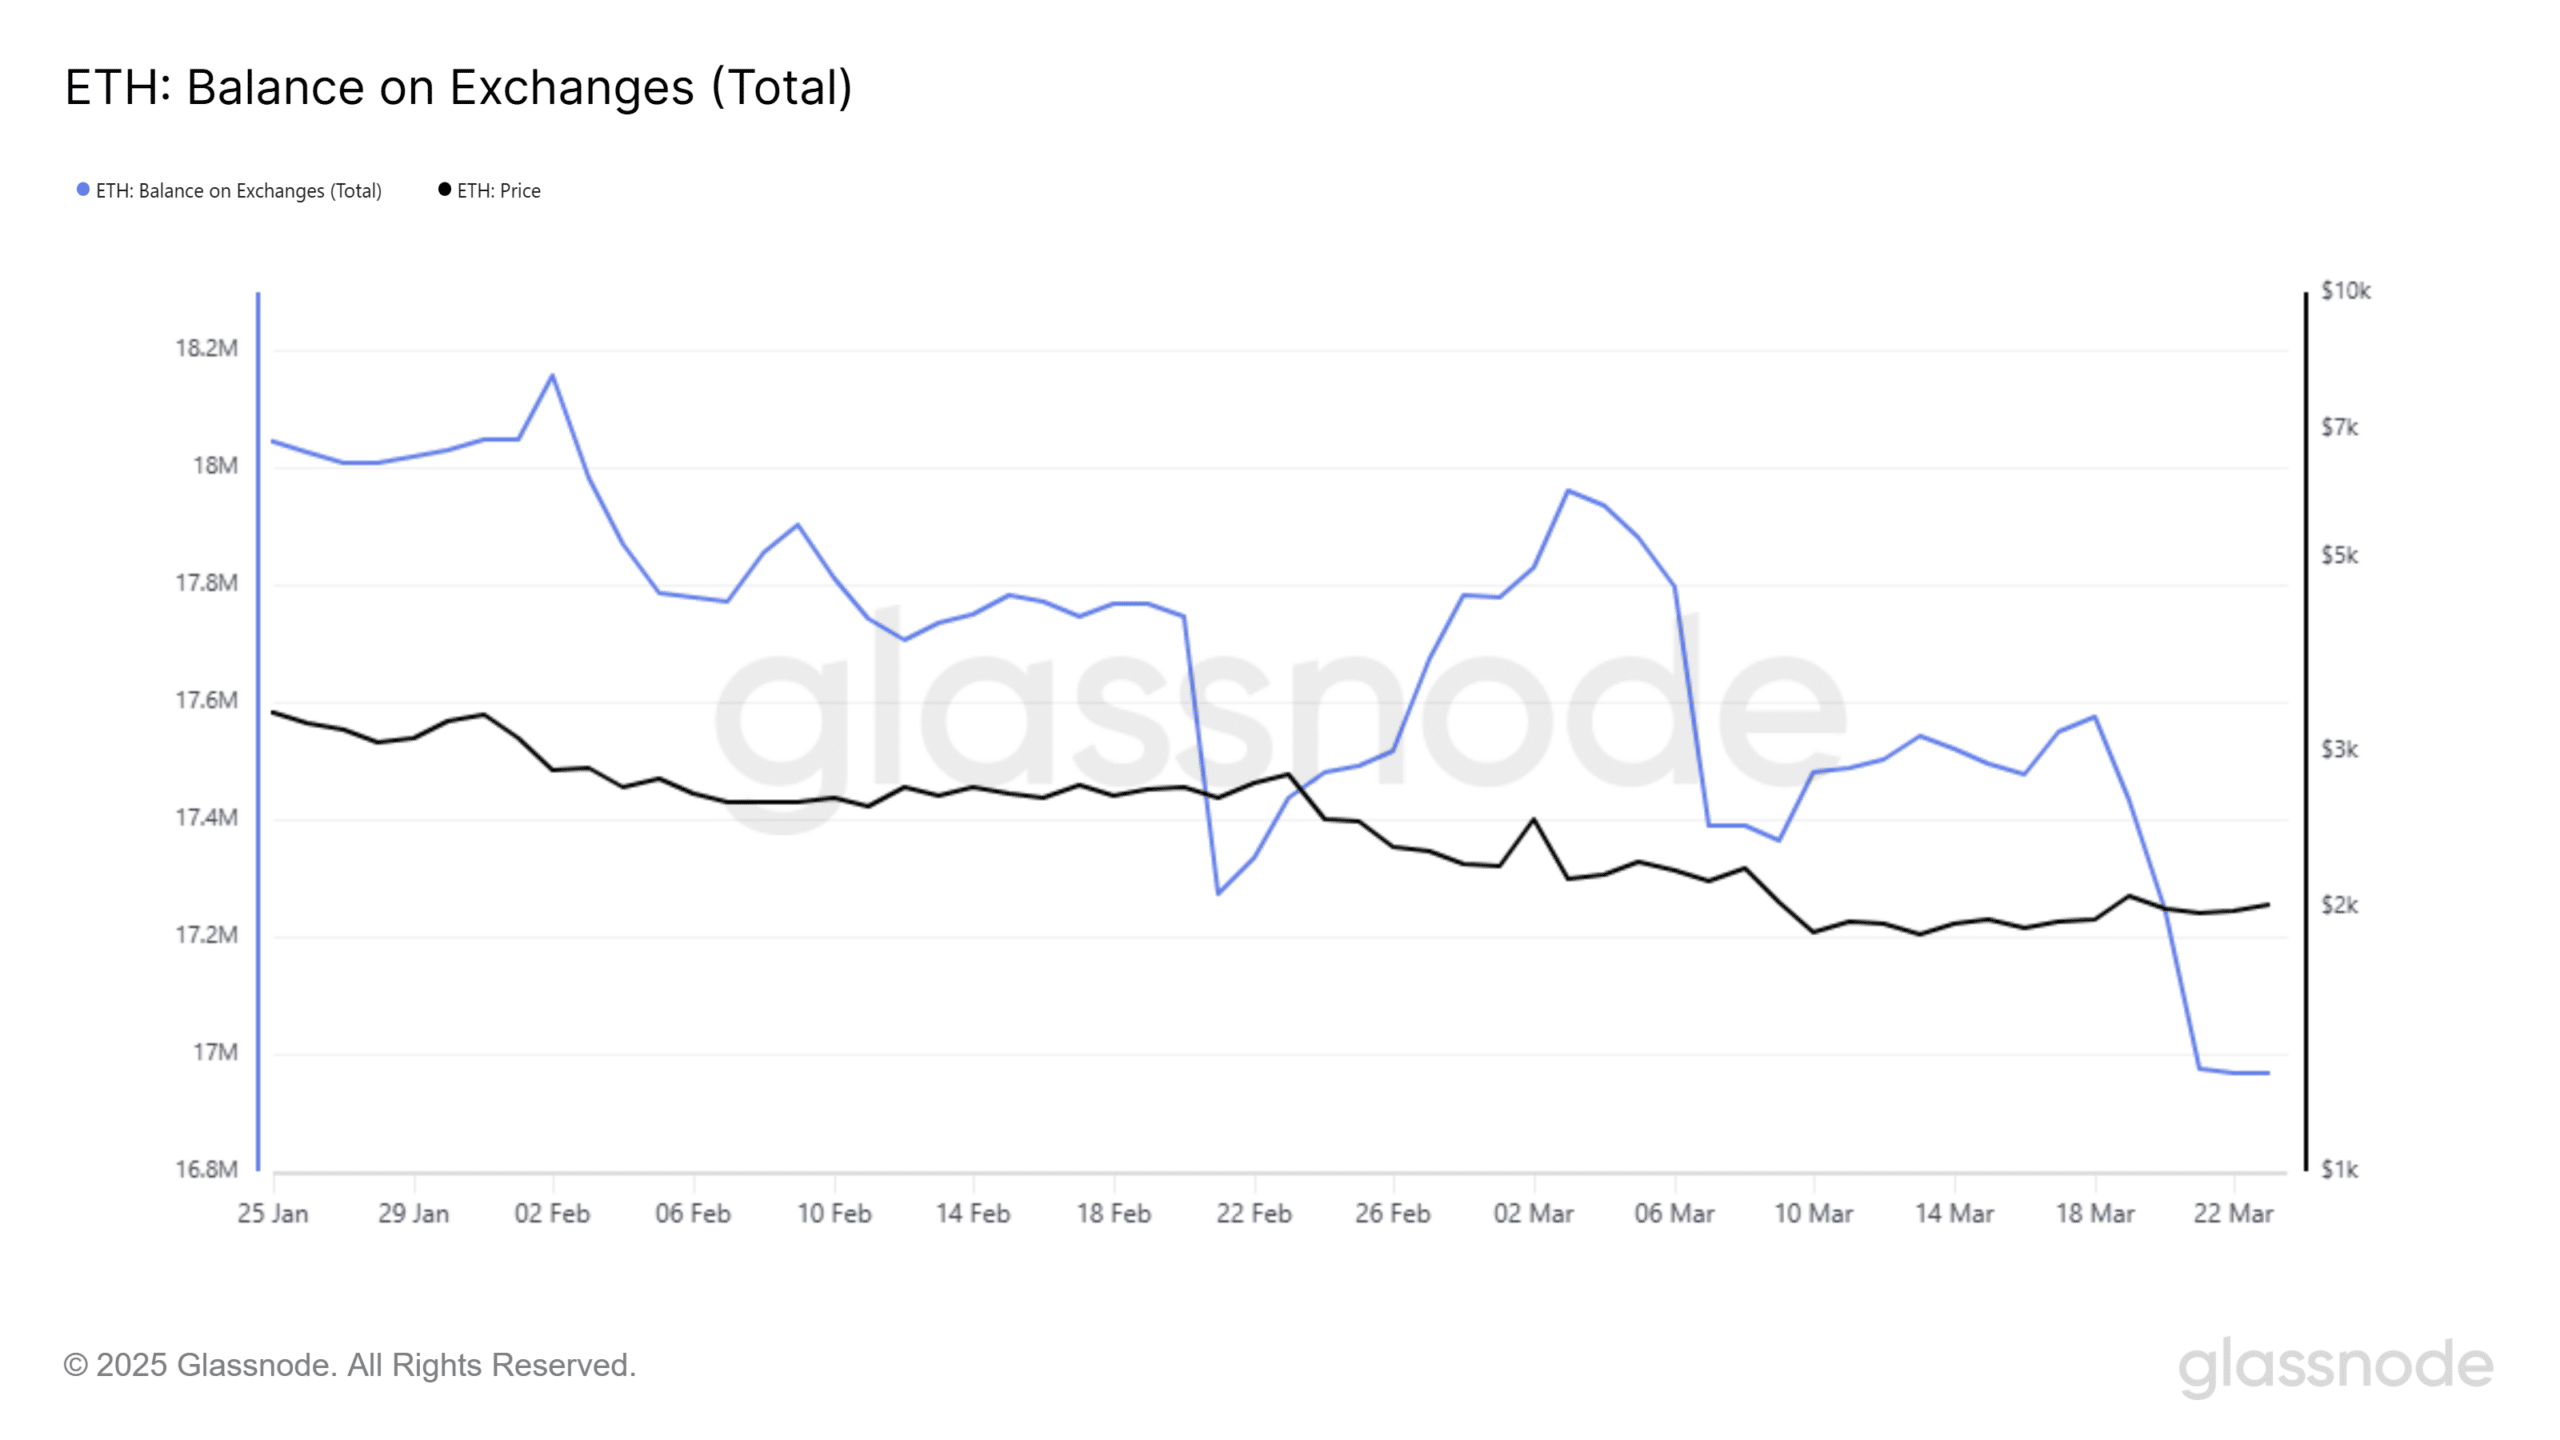
Source: Glassnode
However, price has remained largely rangebound, implying that even as investors hold, they’re not rushing to buy either. In this environment, stability may say more about caution than conviction.
Whale accumulation surges as ETH crosses $2K
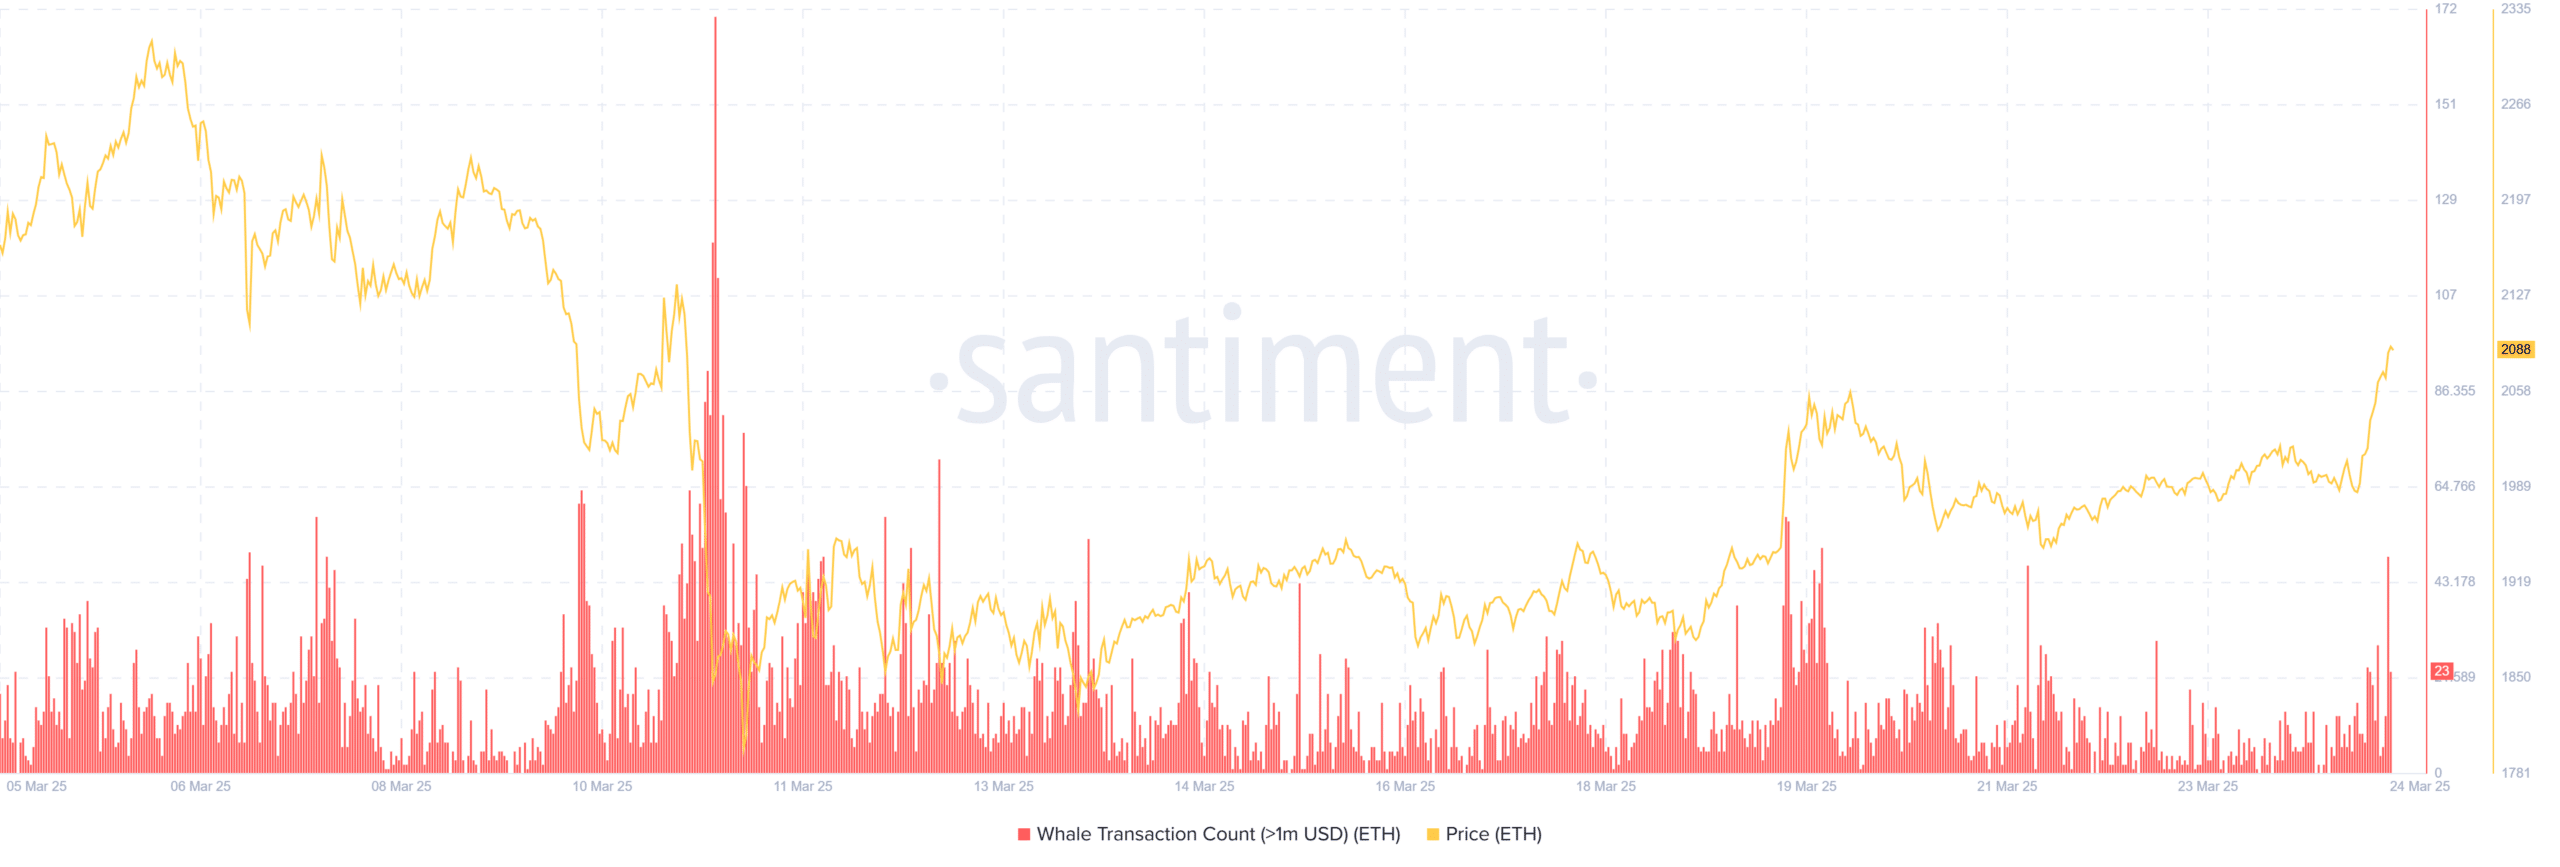
Source: Santiment
Ethereum whales have stepped up aggressively, scooping up nearly 470,000 ETH over the past week.
This surge in large-value transactions came just as ETH reclaimed the $2,000 mark, suggesting whales are positioning ahead of a potential breakout.
Santiment data showed a sharp uptick in whale transaction count beginning the 19th of March, adding weight to the idea that institutional and high-net-worth players see current price levels as an accumulation zone, not a local top.
Ethereum price action hints at recovery, but resistance looms
Ethereum posted a 4.23% gain to trade around $2,090, signaling a potential short-term recovery.
The daily chart shows bullish signals beginning to form: the MACD has flipped into green territory, with the MACD line crossing above the signal line — often viewed as a bullish crossover.
Additionally, the RSI has climbed to 48.43, reflecting improving buyer strength without yet breaching overbought conditions.
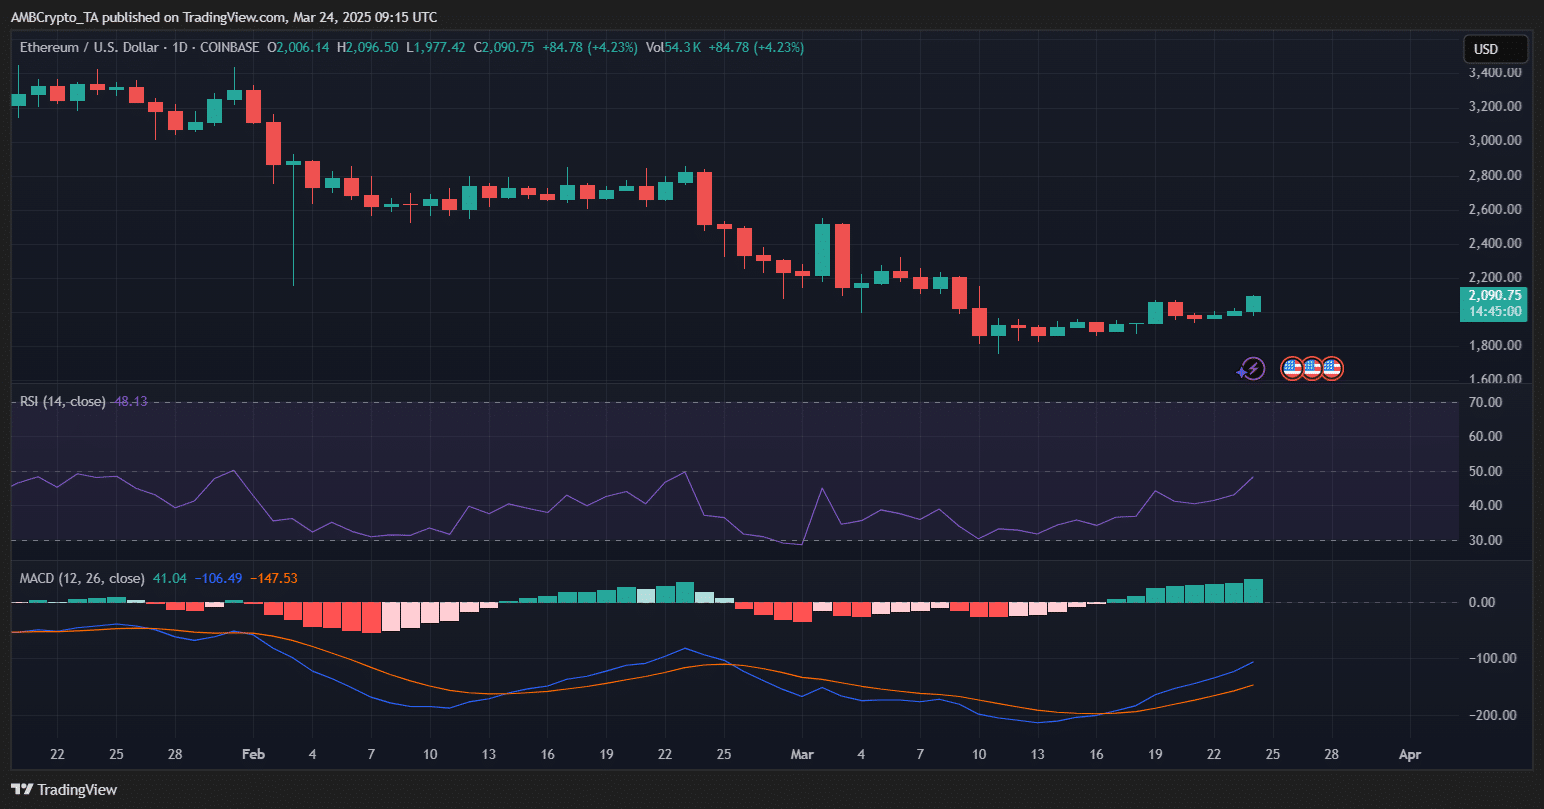
Source: TradingView
Despite these signs, ETH still faces resistance near the $2,200-$2,250 range, last seen in early March. A successful close above this zone could open the door to a retest of the $2,400 level.
However, if momentum stalls, ETH could pull back to retest $2,000 as support.
For now, whale accumulation and improving on-chain sentiment appear to be giving Ethereum the fuel it needs — but a clean breakout is still needed to confirm a broader trend reversal.