Ethereum, Solana, Chainlink Price Analysis: 04 January

While the broader market struggled to ramp up a convincing rally to alter the bearish trend, Solana continued to show range-bound oscillation tendencies. Ethereum, however, crossed the $3,766-mark but still could not gather enough volumes.
On the Other hand, Chainlink’s near-term SMA crossed its 50-200 SMA, indicating a strong bullish vigor.
Ethereum (ETH)
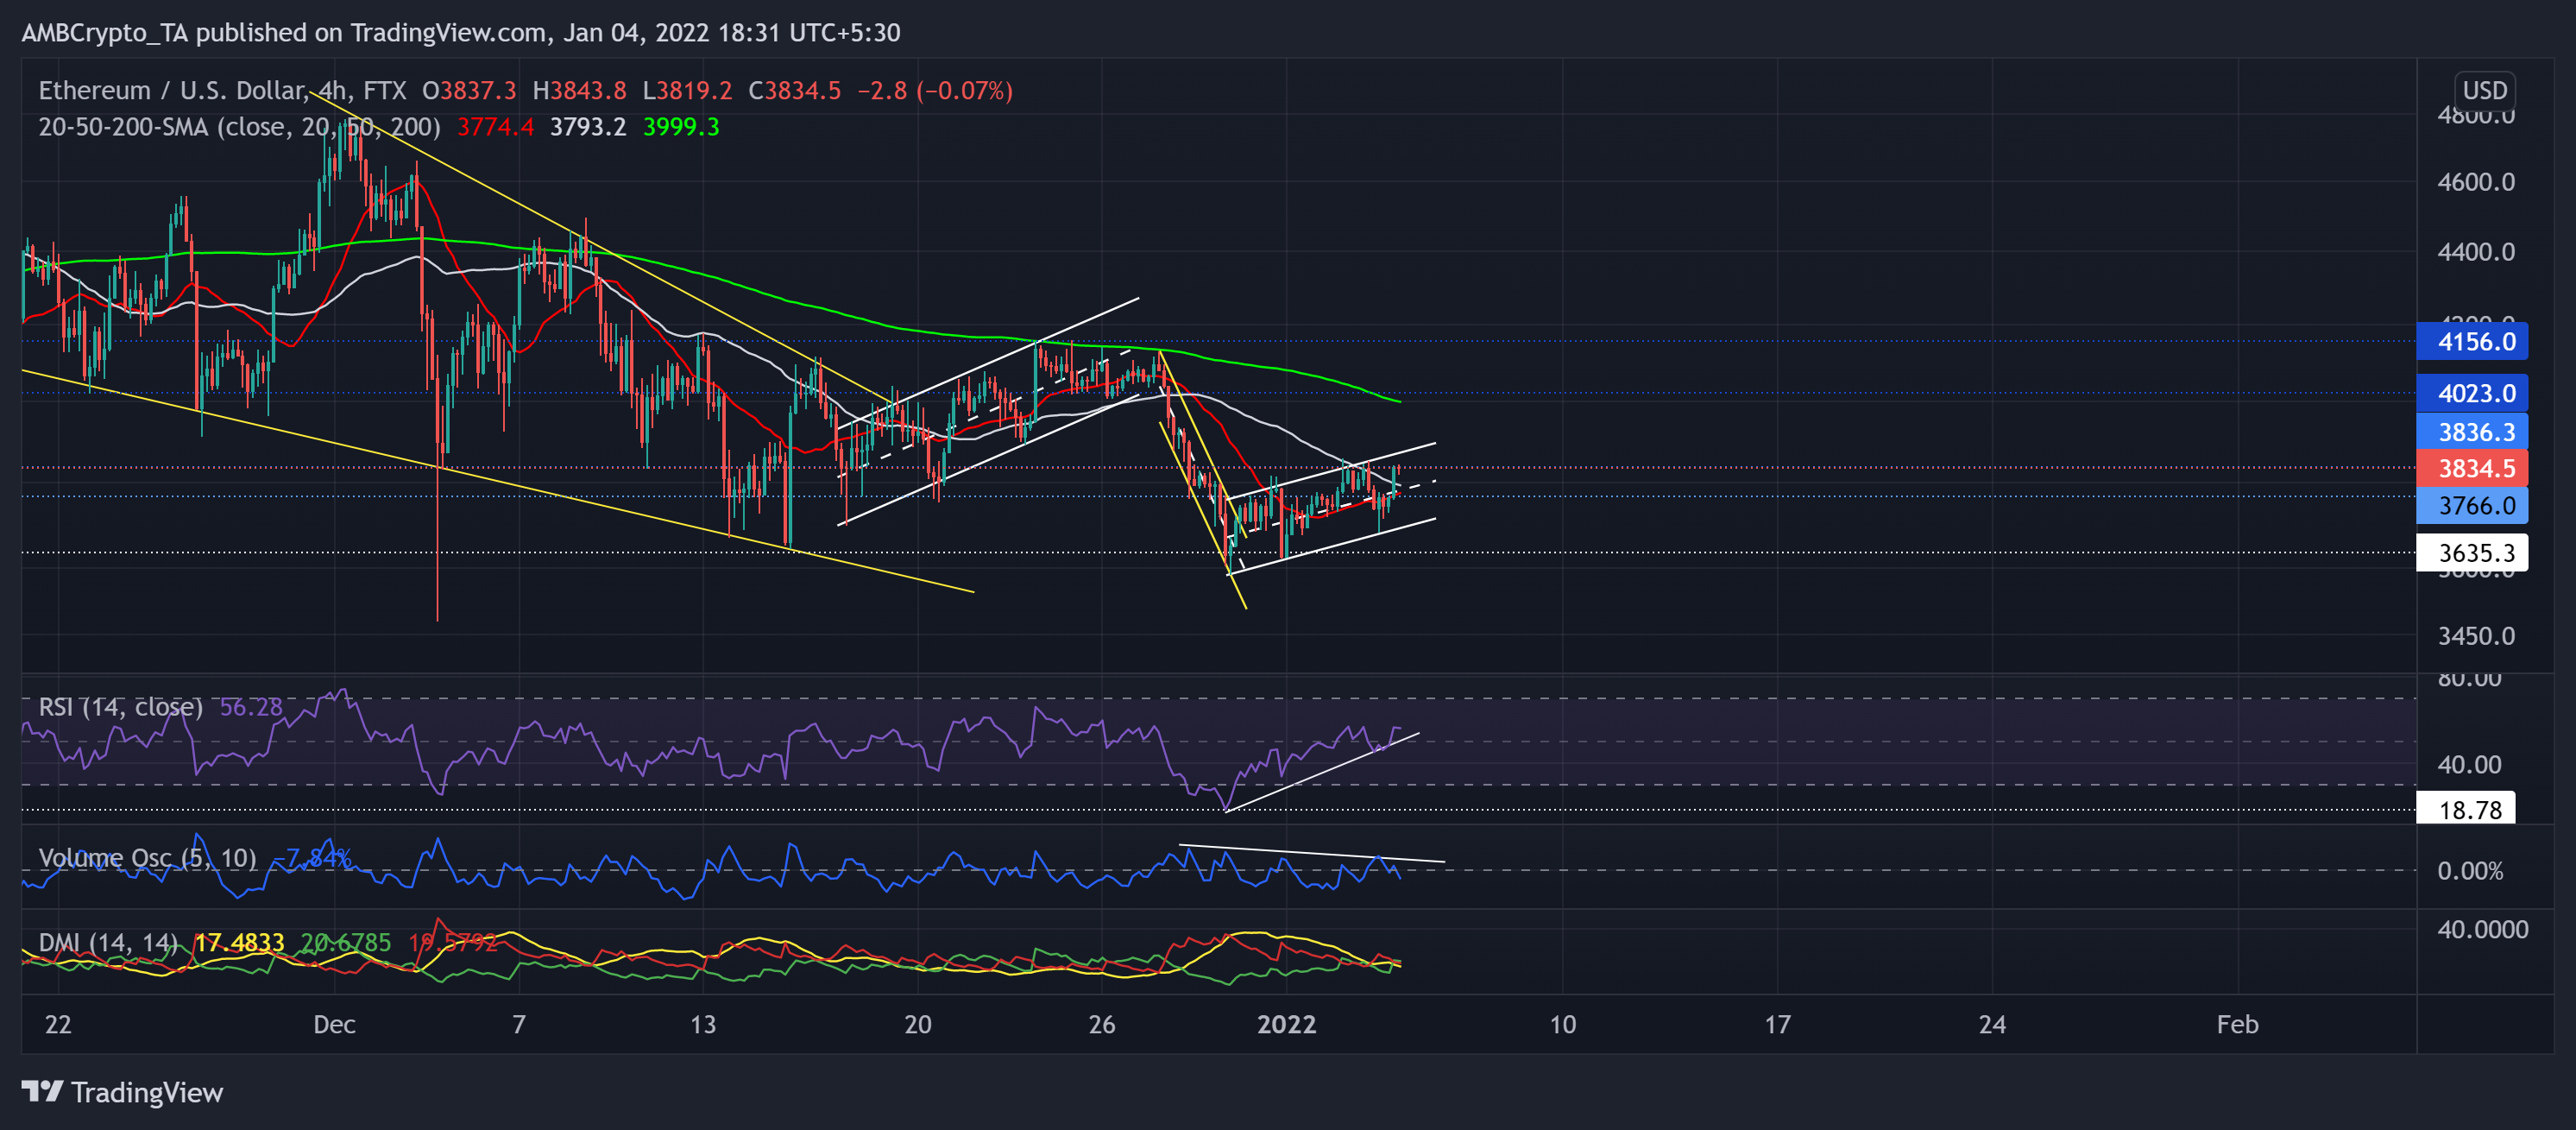
After a down-channel breakout, ETH saw a recovery that crossed the $3,766-support and tested the $3,836-level resistance three times in the last two days. The king alt formed an ascending channel (white) on its 4-hour chart.
Now immediate support stood at the half-line of the up-channel that coincided with the 20-SMA (red). However, the Volume Oscillator was still in a downtrend, indicating a weak bullish motion.
At press time, the alt traded at $3,834.5. After poking its record low of 18.78, the RSI saw higher peaks and troughs. It finally sustained a close above the half-line. While the DMI depicted a slight bullish preference, the ADX displayed a weak directional trend for the alt.
Solana (SOL)

Over the past day, the alt saw a 5% setback, but the bulls were quick to reclaim the 61.8% Fibonacci support.
SOL continued its low volatility phase by finding an oscillation range between the $176 and $167-mark. Thus, the Squeeze Momentum Indicator still flashed black dots.
At press time, the alt traded at 171.3875. The RSI was at the 46-mark after finding a strong resistance near the half-line. Also, the DMI showed a bearish preference, but the ADX displayed a weak directional trend.
Chainlink (LINK)
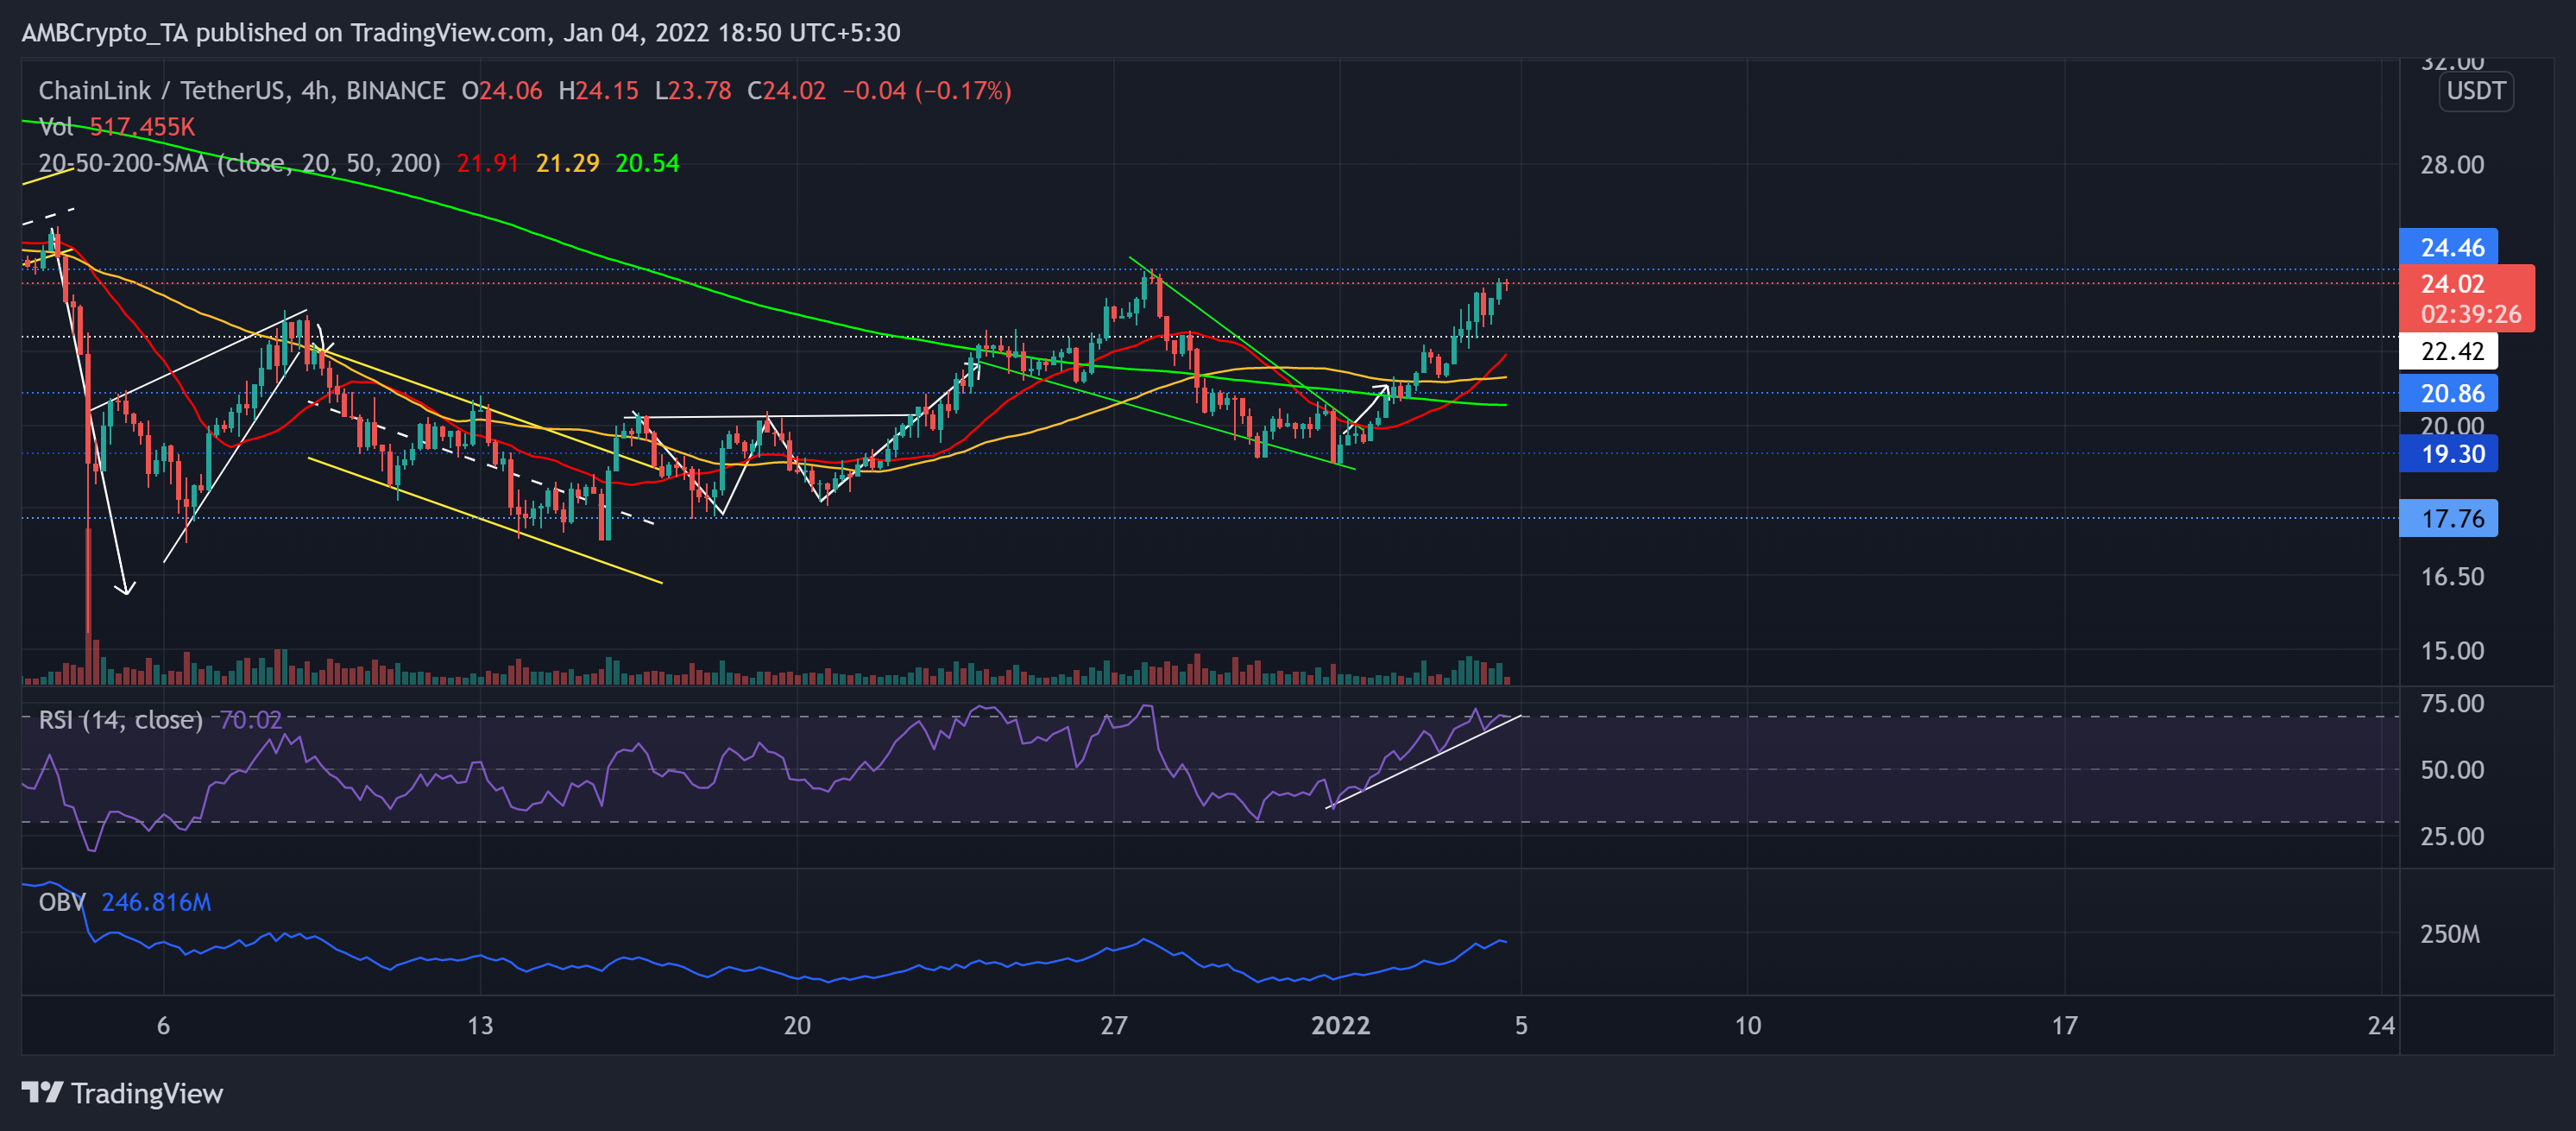
The price action oscillated in a down-channel (yellow) and tested the support at $17.7 nearly seven times before forming a double bottom.
Over the past week, the alt declined in a falling wedge (green) while the bulls ensured the $19.3-support. The recent breakout propelled a 25.13% ROI in the last four days. With this upturn, LINK’s 20 SMA crossed its 50-200 SMA hinting at a one-sided-bullish momentum. Now, the immediate resistance stood at the $24.46-level.
At press time, the alt traded at $24.02. The RSI was in a clear uptrend as it approached the overbought region. Also, the corresponding volumes and OBV saw a spike, indicating a healthy breakout.