Ethereum, Solana, Fantom Price Analysis: 09 January

While Bitcoin reentered the $41,000-zone, Ether and Solana lost their golden 61.8% Fibonacci support. Their near-term technicals skewed in favor of the sellers.
On the other hand, Fantom lost over 30% of its value in the last four days but its OBV managed to maintain the high level.
Ether (ETH)
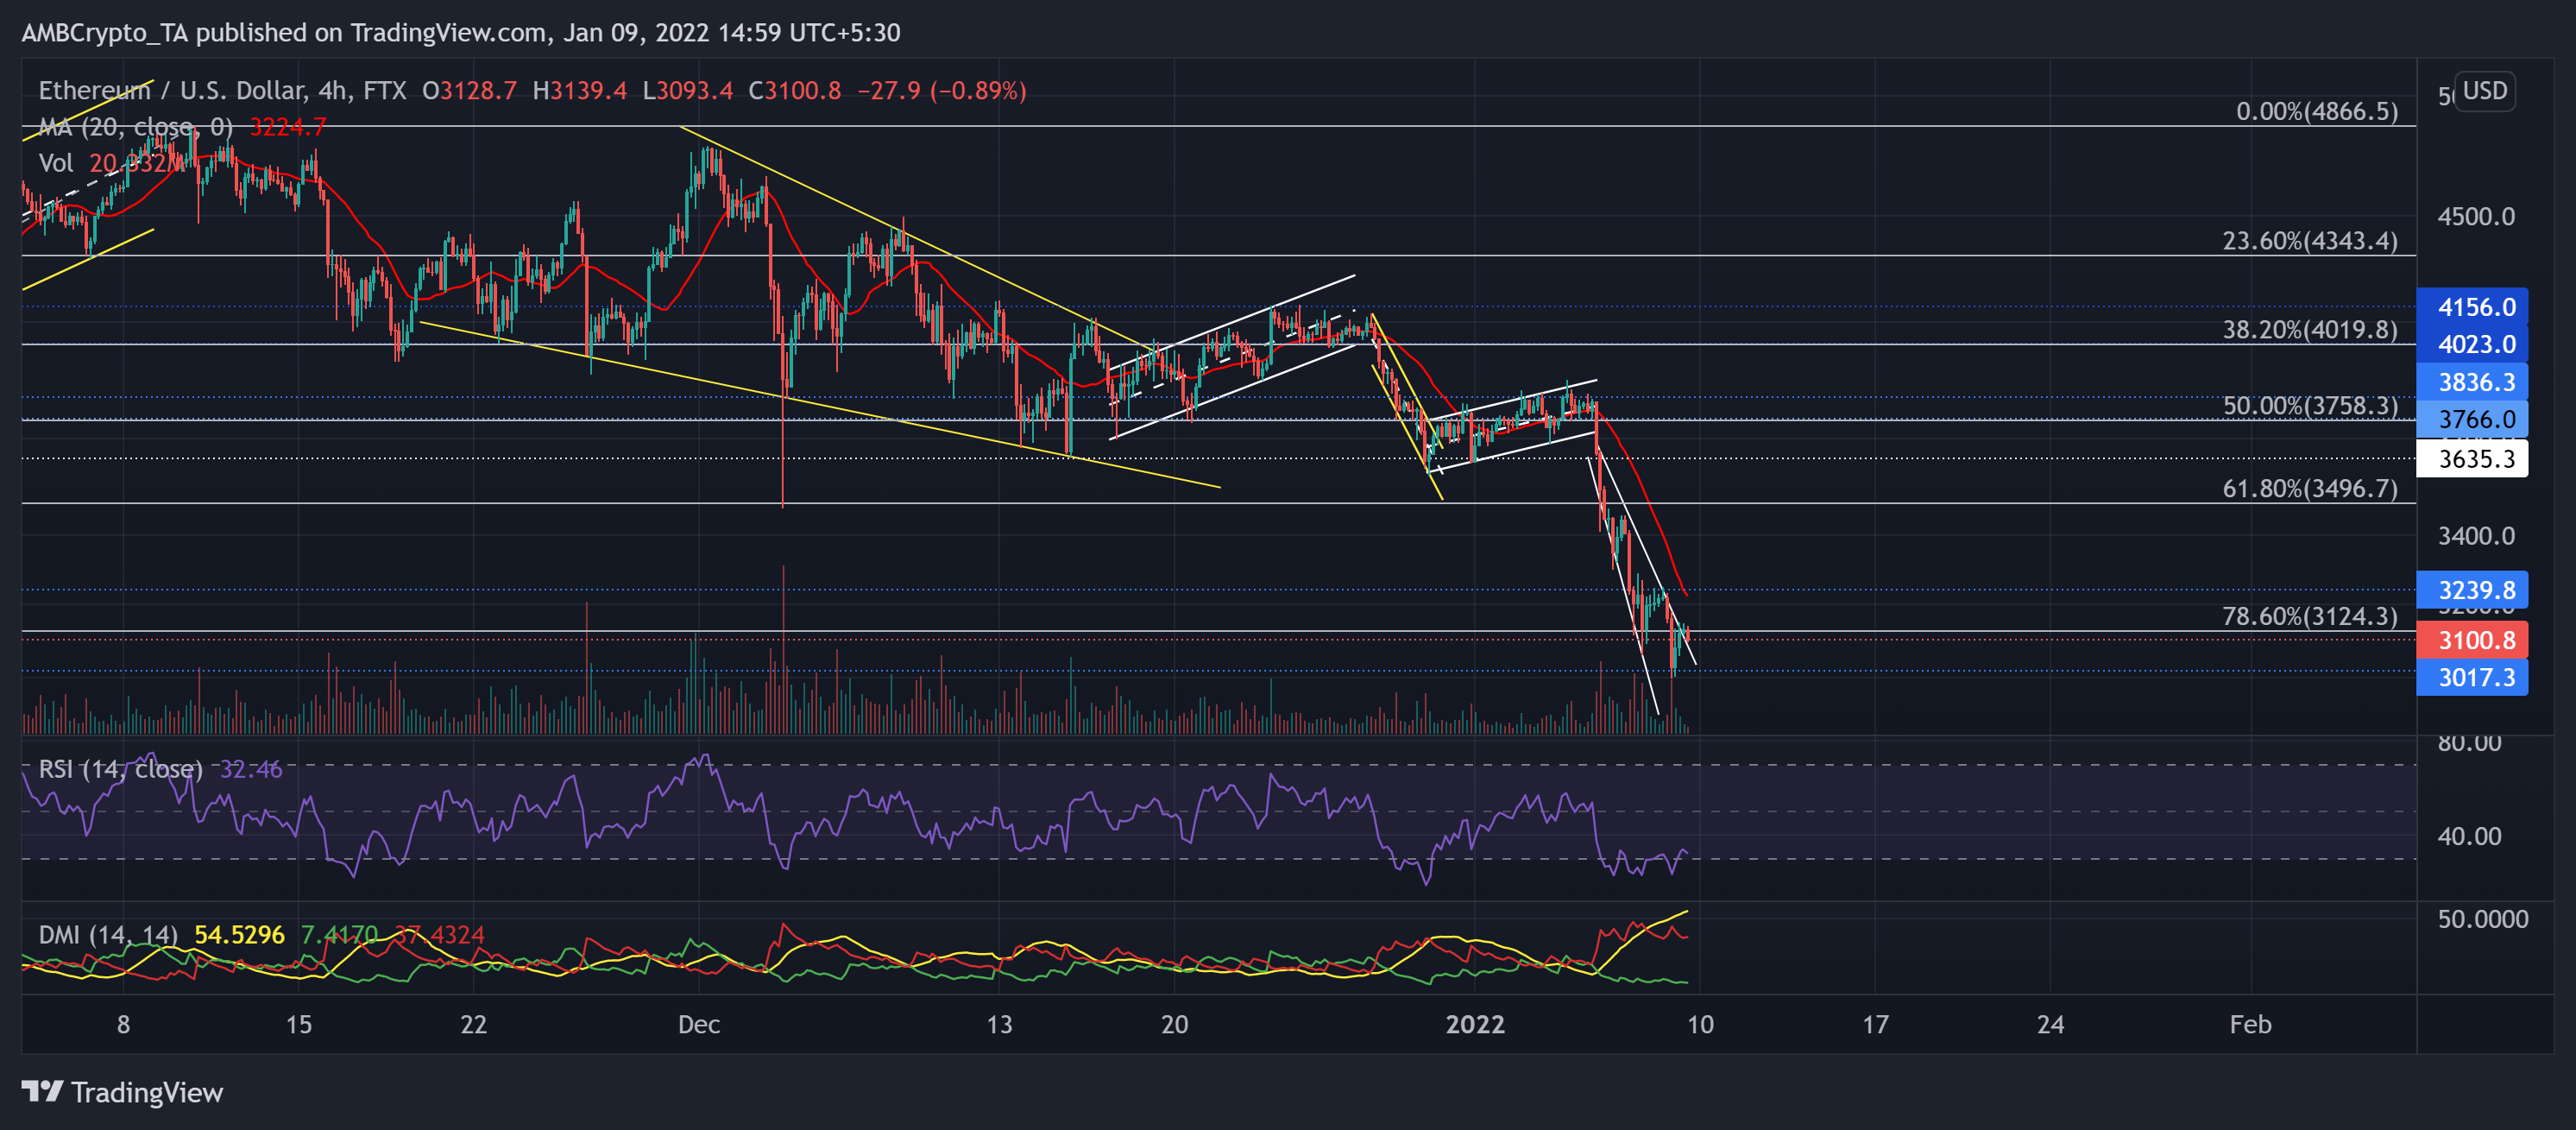
ETH fueled its long-term bearish tendencies after a meltdown from the up-channel (white). It lost over 19.08% of its value from 5 January and lost 61.8%, 78.6% longer timeframe Fibonacci supports.
The king alt formed a falling wedge (white) on its 4-hour chart after ensuring the $3000-mark support for over three months now. From here on, ETH found it challenging to break out of the $3,100-level. The next hurdle stood at the $3,200-mark that coincided with the 20-SMA (red).
At press time, the alt traded at $3,100.8. For the past three days, the RSI swayed around the oversold region. It did not flash a sturdy revival at the time of writing. Further, the wide gap between the +DI and -DI visibly confirmed the bearish outlook. Recently, the selling volumes were higher than incline volumes. Thus, indicating a strong bear market.
Solana (SOL)

Over the past three days, SOL saw increased selling pressure leading to a descending triangle (white) breakout on its 4-hour chart. The alt fell below its 61.8% Fibonacci support and tested the $167-mark multiple times. It was critical for the buyers to step in at this point to prevent a further breakdown.
While they failed to step up, the alt saw a 34.97% retracement (from 27 December high) and lost further Fibonacci levels and obliged the 14-week support at $134.96-level. The immediate testing point for the bulls stood at the 20-SMA (red).
At press time, the alt traded at $139.4025. Despite a revival, RSI stood weak at the 39-level. Also, the DMI showed a bearish preference while the ADX displayed a strong directional trend.
Fantom (FTM)
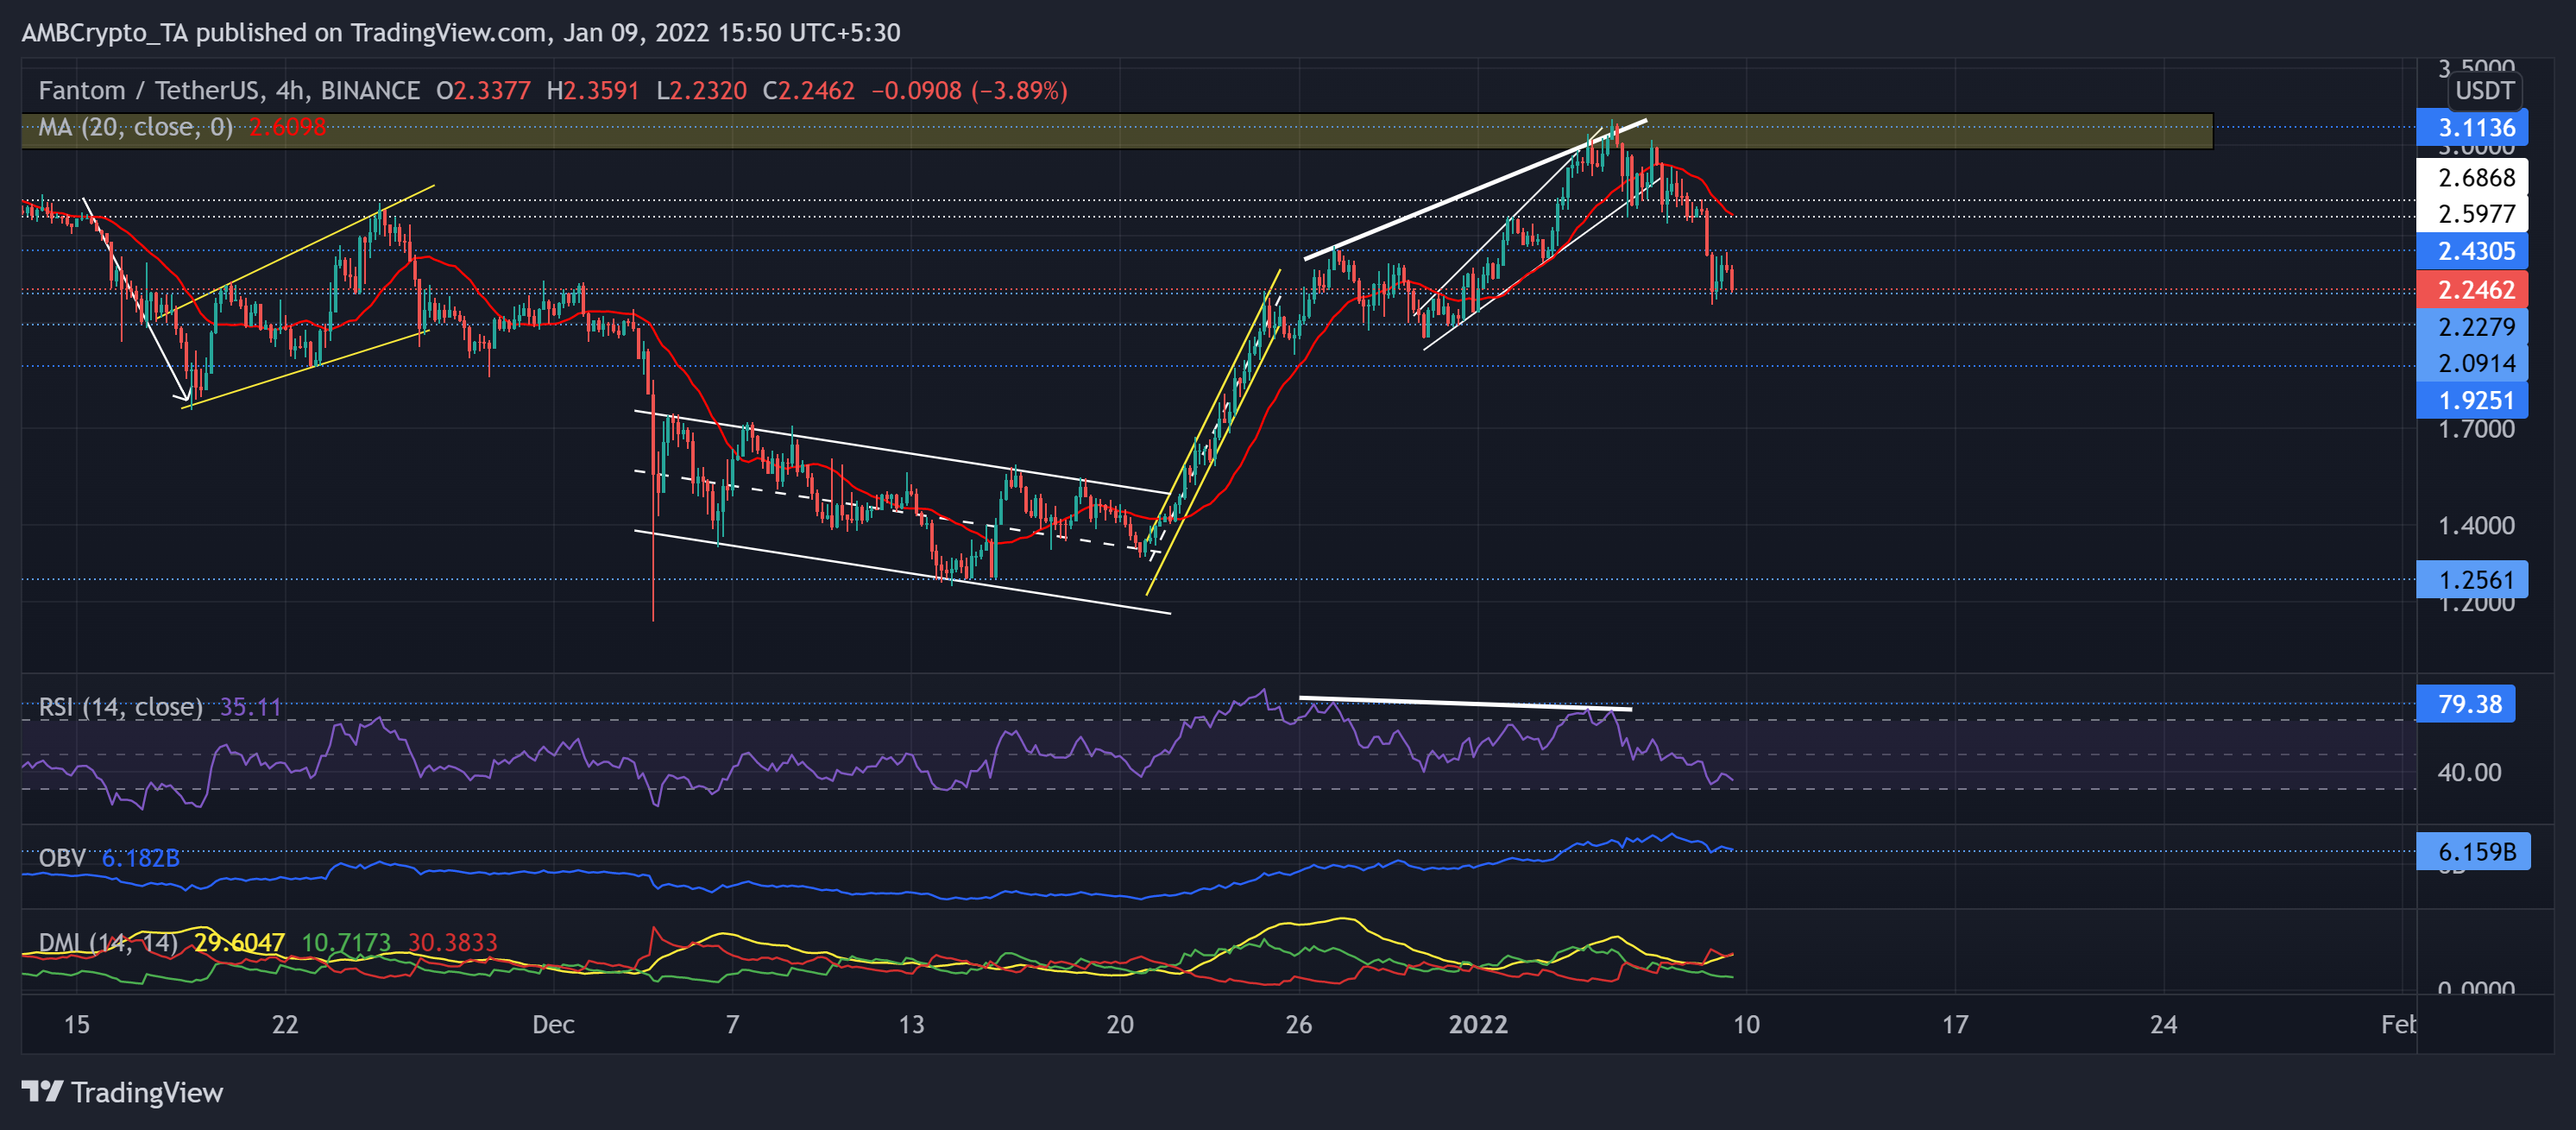
As we saw in the previous article, after forming a bearish divergence (white), FTM price action reversed from its supply zone (rectangle, yellow).
The ascending broadening wedge (white) broke down after FTM poked its two-month high on 5 January. Since then, the alt lost nearly one-third of its value to find testing grounds at $2.22-mark. Any further downfall would find testing support at the $2.09-level.
At press time, FTM traded 34.4% below its ATH at $2.2462. The RSI solidly downturned and looked toward the oversold territory at the time of writing. Further, the DMI flashed a bearish bias too. However, the OBV maintained the level that it had at $3.01 and did not lose its support. This reading indicated the existence of strong buying pressure.