Ethereum stares down a cliff as median gas price soars to monthly high

- Ethereum’s network demand and bullish price action underpin the surge in gas fee prices.
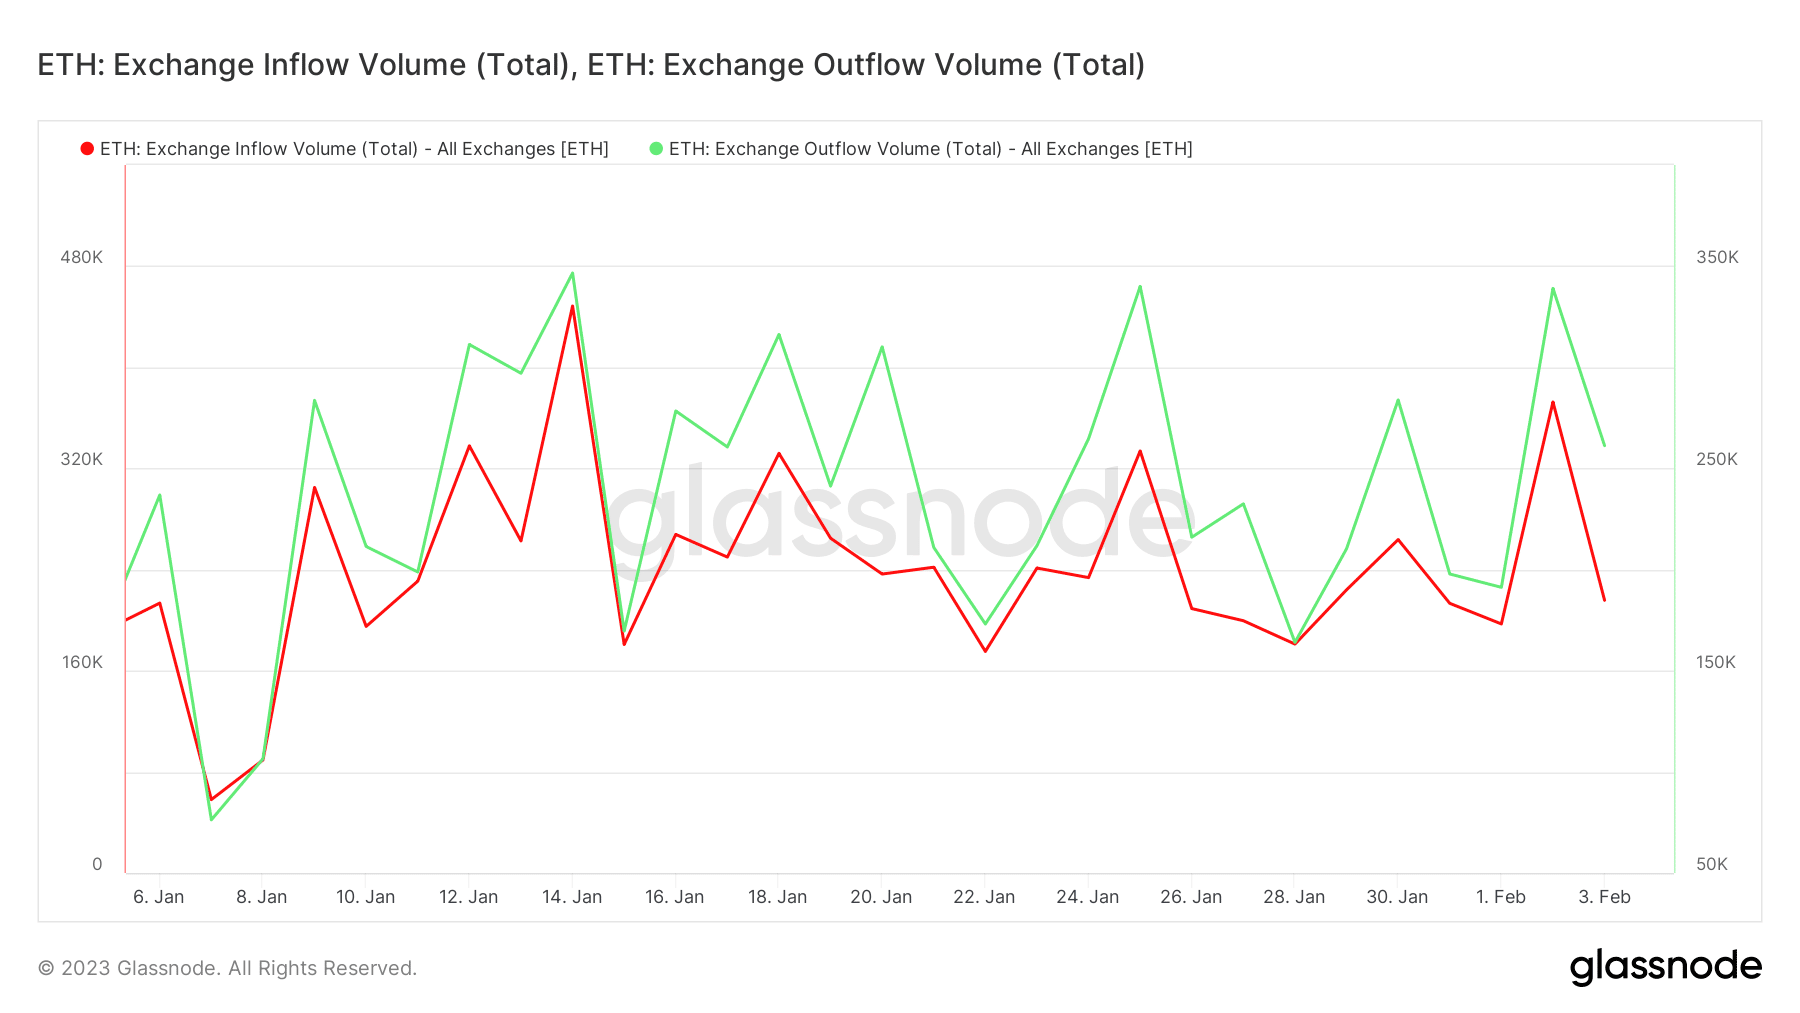
- ETH net exchange outflows support bullish dominance despite the market slowdown.
The Ethereum network has been criticized in the past for the expensive nature of fees. This is often the case especially when there is a lot of network usage and when ETH’s price soars.
ETH’s latest price suggests that this will continue to be the case in 2023 if the market is on the road to recovery.
Realistic or not, here’s Ethereum’s market cap in BTC’s terms
One of the latest Glassnode alerts revealed that ETH’s median gas price is now at a new monthly high. This is unsurprising considering that we have seen a strong recovery in the amount of on-chain activity since the start of the year. It confirms that network demand improved significantly.
📈 #Ethereum $ETH Median Gas Price (7d MA) just reached a 1-month high of 23.128 GWEI
Previous 1-month high of 23.097 GWEI was observed on 19 January 2023
View metric:https://t.co/6QGDfZoULY pic.twitter.com/s7TzVcGIEF
— glassnode alerts (@glassnodealerts) February 4, 2023
Why are gas fee prices increasing?
There might be more than one factor affecting the gas fee prices as has been the case historically. One of them is that higher network demand causes congestion and higher demand for ETH and tokens used to pay the gas price.
The other reason is that this is a common occurrence during a bull market. The same principle applies, where demand for the underlying cryptocurrency or token pushes up the price.
The second reason likely has the biggest impact on prices. Both factors have been at play for the last four weeks during which ETH managed to pull off a 40% upside. Well, at the time of writing, ETH traded at $1680.
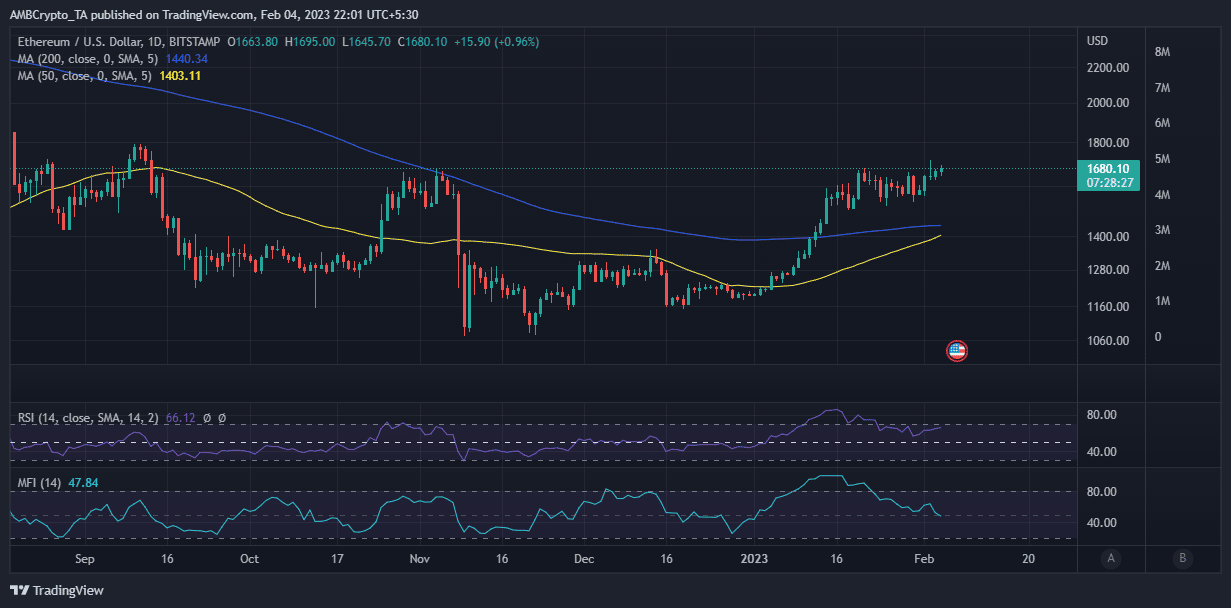
ETH’s current price is one to watch because it is within a resistance zone that it has struggled to overcome in the last few days. Whether it will breakout, stay within the current range, or retrace is still a toss-up.
A look at some of its metrics may offer insights into where it is currently leaning towards.
Is your portfolio green? Check out the Ehereum Profit Calculator
Both network growth and transaction count maintained noteworthy levels in the last four weeks. However, the same metrics crashed to their lowest monthly levels in the last 24 hours. This may indicate a drop in organic demand within the Ethereum network.
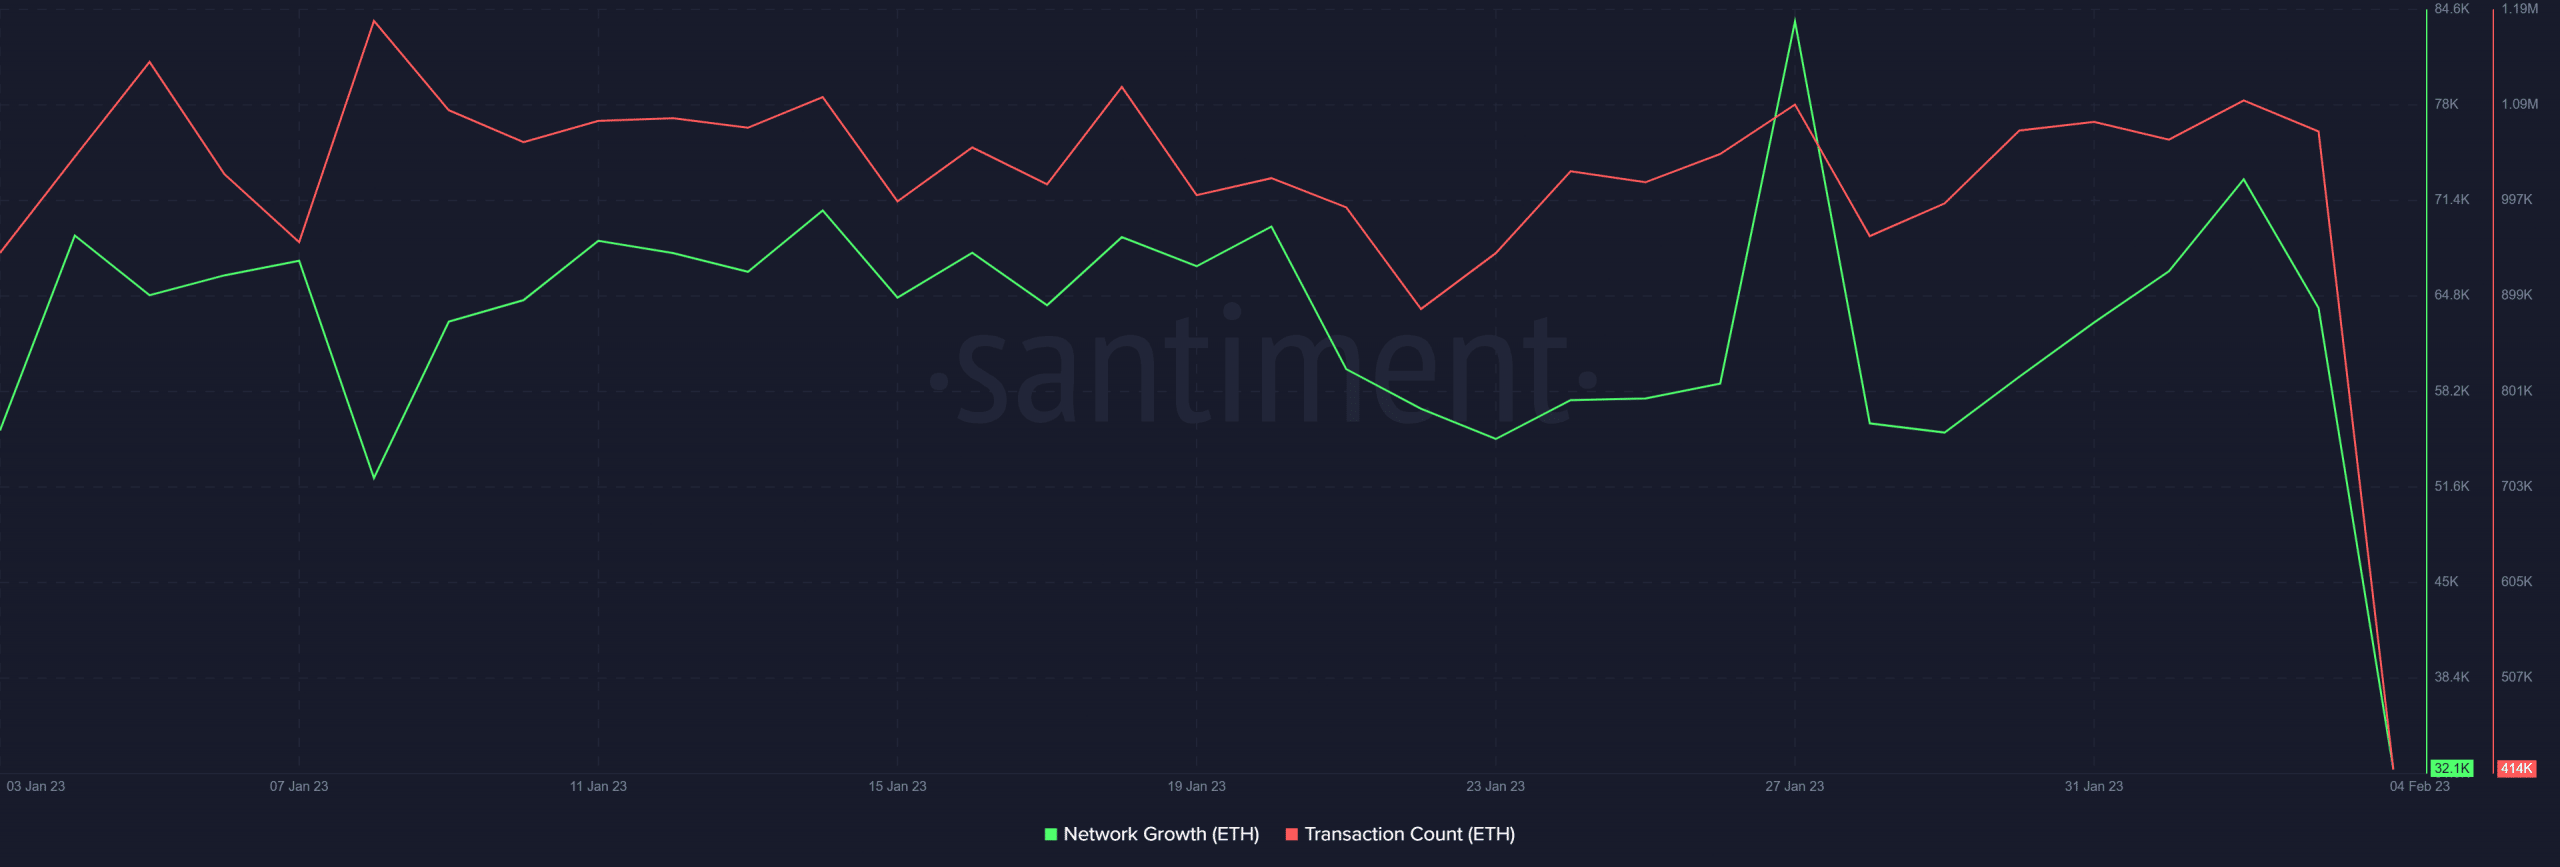
While there is no clear explanation for this observation, a speculative reason might be the FUD that persisted over economic data and FOMC during the week.
Nevertheless, this does not explain why ETH’s price remained in the green since the start of February. ETH exchange flows offer a clearer perspective of the current situation.
Exchange flows did pivot in the last 48 hours, adopting a downward trajectory. This is confirmation of a demand slowdown as noted earlier.
Nevertheless, the amount of exchange outflows remains higher than the inflows. This is why the bulls have retained control, albeit barely.