
- Outflows from spot Ether ETFs have totaled $433M after three consecutive days of outflows.
- The declining demand for ETH alongside a rising supply has hampered Ethereum’s efforts to gain.
The cryptocurrency market made a strong rebound on Tuesday during the Asian trading session. Ethereum [ETH] has gained around 2% to trade at $2,678 at the time of writing.
However, despite the recent gains, the largest altcoin has lost 23% of its value since spot Ether exchange-traded funds (ETFs) launched in the US last month.
So, what is weighing down Ethereum’s price?
Ethereum ETF outflows hit $433M
The cumulative net outflows from spot Ethereum ETFs stood at $433M at press time.
The Grayscale Ethereum Trust ETF (ETHE), that launched with $10 billion in assets, has posted a consistent negative flow since its launch. The ETF still holds $4.84 billion in net assets, elevating further downside risk.
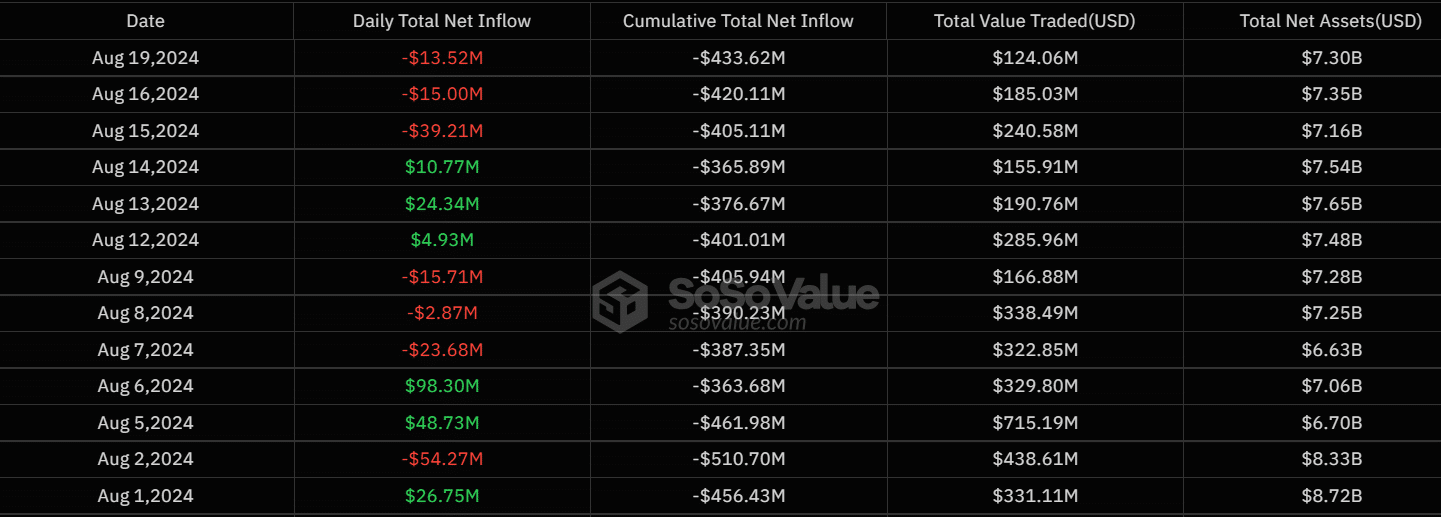
Source: SoSoValue
Last week, Framework Ventures co-founder, Vance Spencer predicted that investors might eventually allocate their portfolios with a 50-50 split between Bitcoin and Ether ETFs.
However, over the last three trading days, Bitcoin ETFs have had consecutive inflows while Ethereum ETFs saw consecutive outflows.
Declining network activity increases ETH supply
Ethereum’s network has also seen a decline in usage, as seen on DappRadar.
The number of unique active wallets (UAW) on the Ethereum network has dropped by 20% in the last 30 days. The 30-day user count on Ethereum stands at 1.66 million, ranking it sixth by this metric.
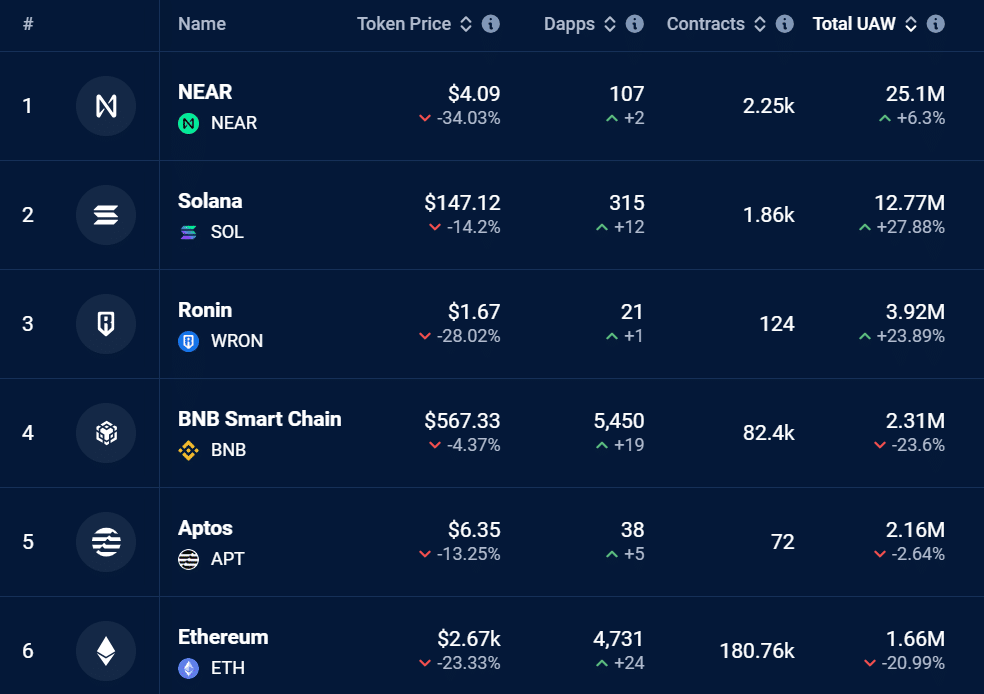
Source: DappRadar
The declining network usage has also affected the amount of ETH tokens burned, which has, in turn, increased supply, making Ethereum inflationary.
Data from Ultrasound Money showed that in the last seven days, around 18,000 ETH tokens were issued, while only 1,500 were burned.
This meant that ETH’s supply has increased by more than 16,000 tokens within seven days. The rising supply on the back of reducing demand has exerted downward pressure on ETH.
Indicators signal weak demand
ETH was facing weak demand at press time, which could potentially weigh down on prices. The Chaikin Money Flow, which measures accumulation and distribution, was negative at this time.
So, selling pressure has outweighed buying pressure since early August.
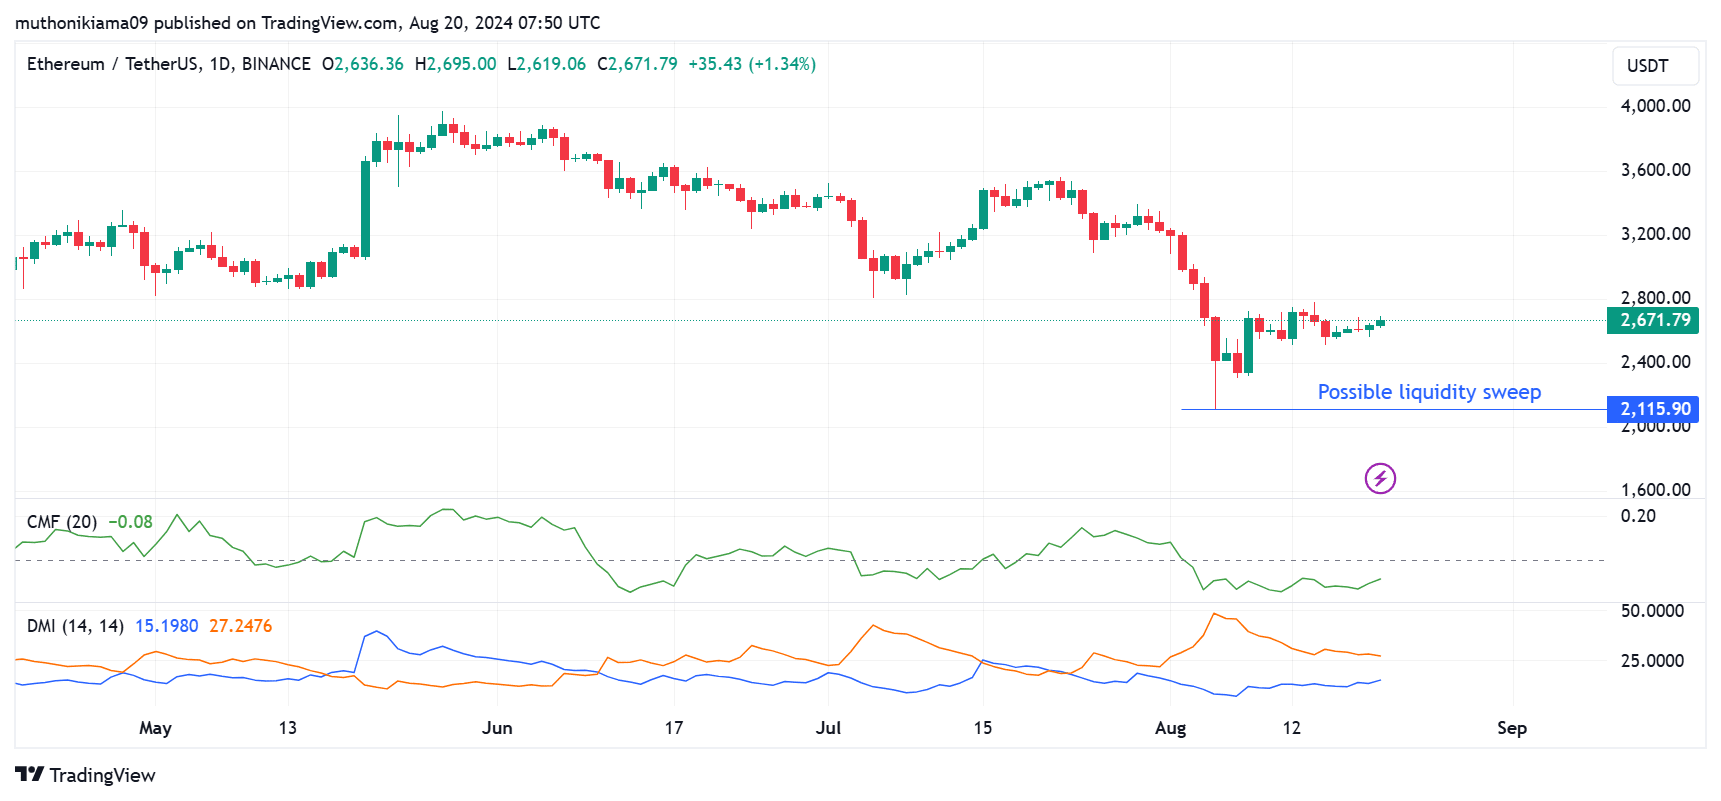
Source: TradingView
The positive Directional Movement Index (DMI) also showed a downtrend, as the positive Directional Indicator has been below the negative Directional Indicator since July.
However, the distance between the two lines has been narrowing, hinting at a potential reversal. Traders should also watch out for a potential liquidity sweep at $2,115 as the price makes a strong rebound.
Realistic or not, here’s ETH’s market cap in BTC’s terms
Per AMBCrypto’s look at CryptoQuant, ETH needs a return of leverage traders for an upward correction.
Also, according to Coinglass, Ethereum’s Open Interest has dropped from a peak of $17 billion in May to the current $10 billion.