Ethereum tests critical resistance level: Will bulls break out past $2,500?
Ethereum's Spot taker buying pressure went up a notch within the past two weeks.



Ethereum [ETH] has expanded northward from a major accumulation zone, data showed. The exchange reserves continued to fall, signaling ETH accumulation was ongoing.
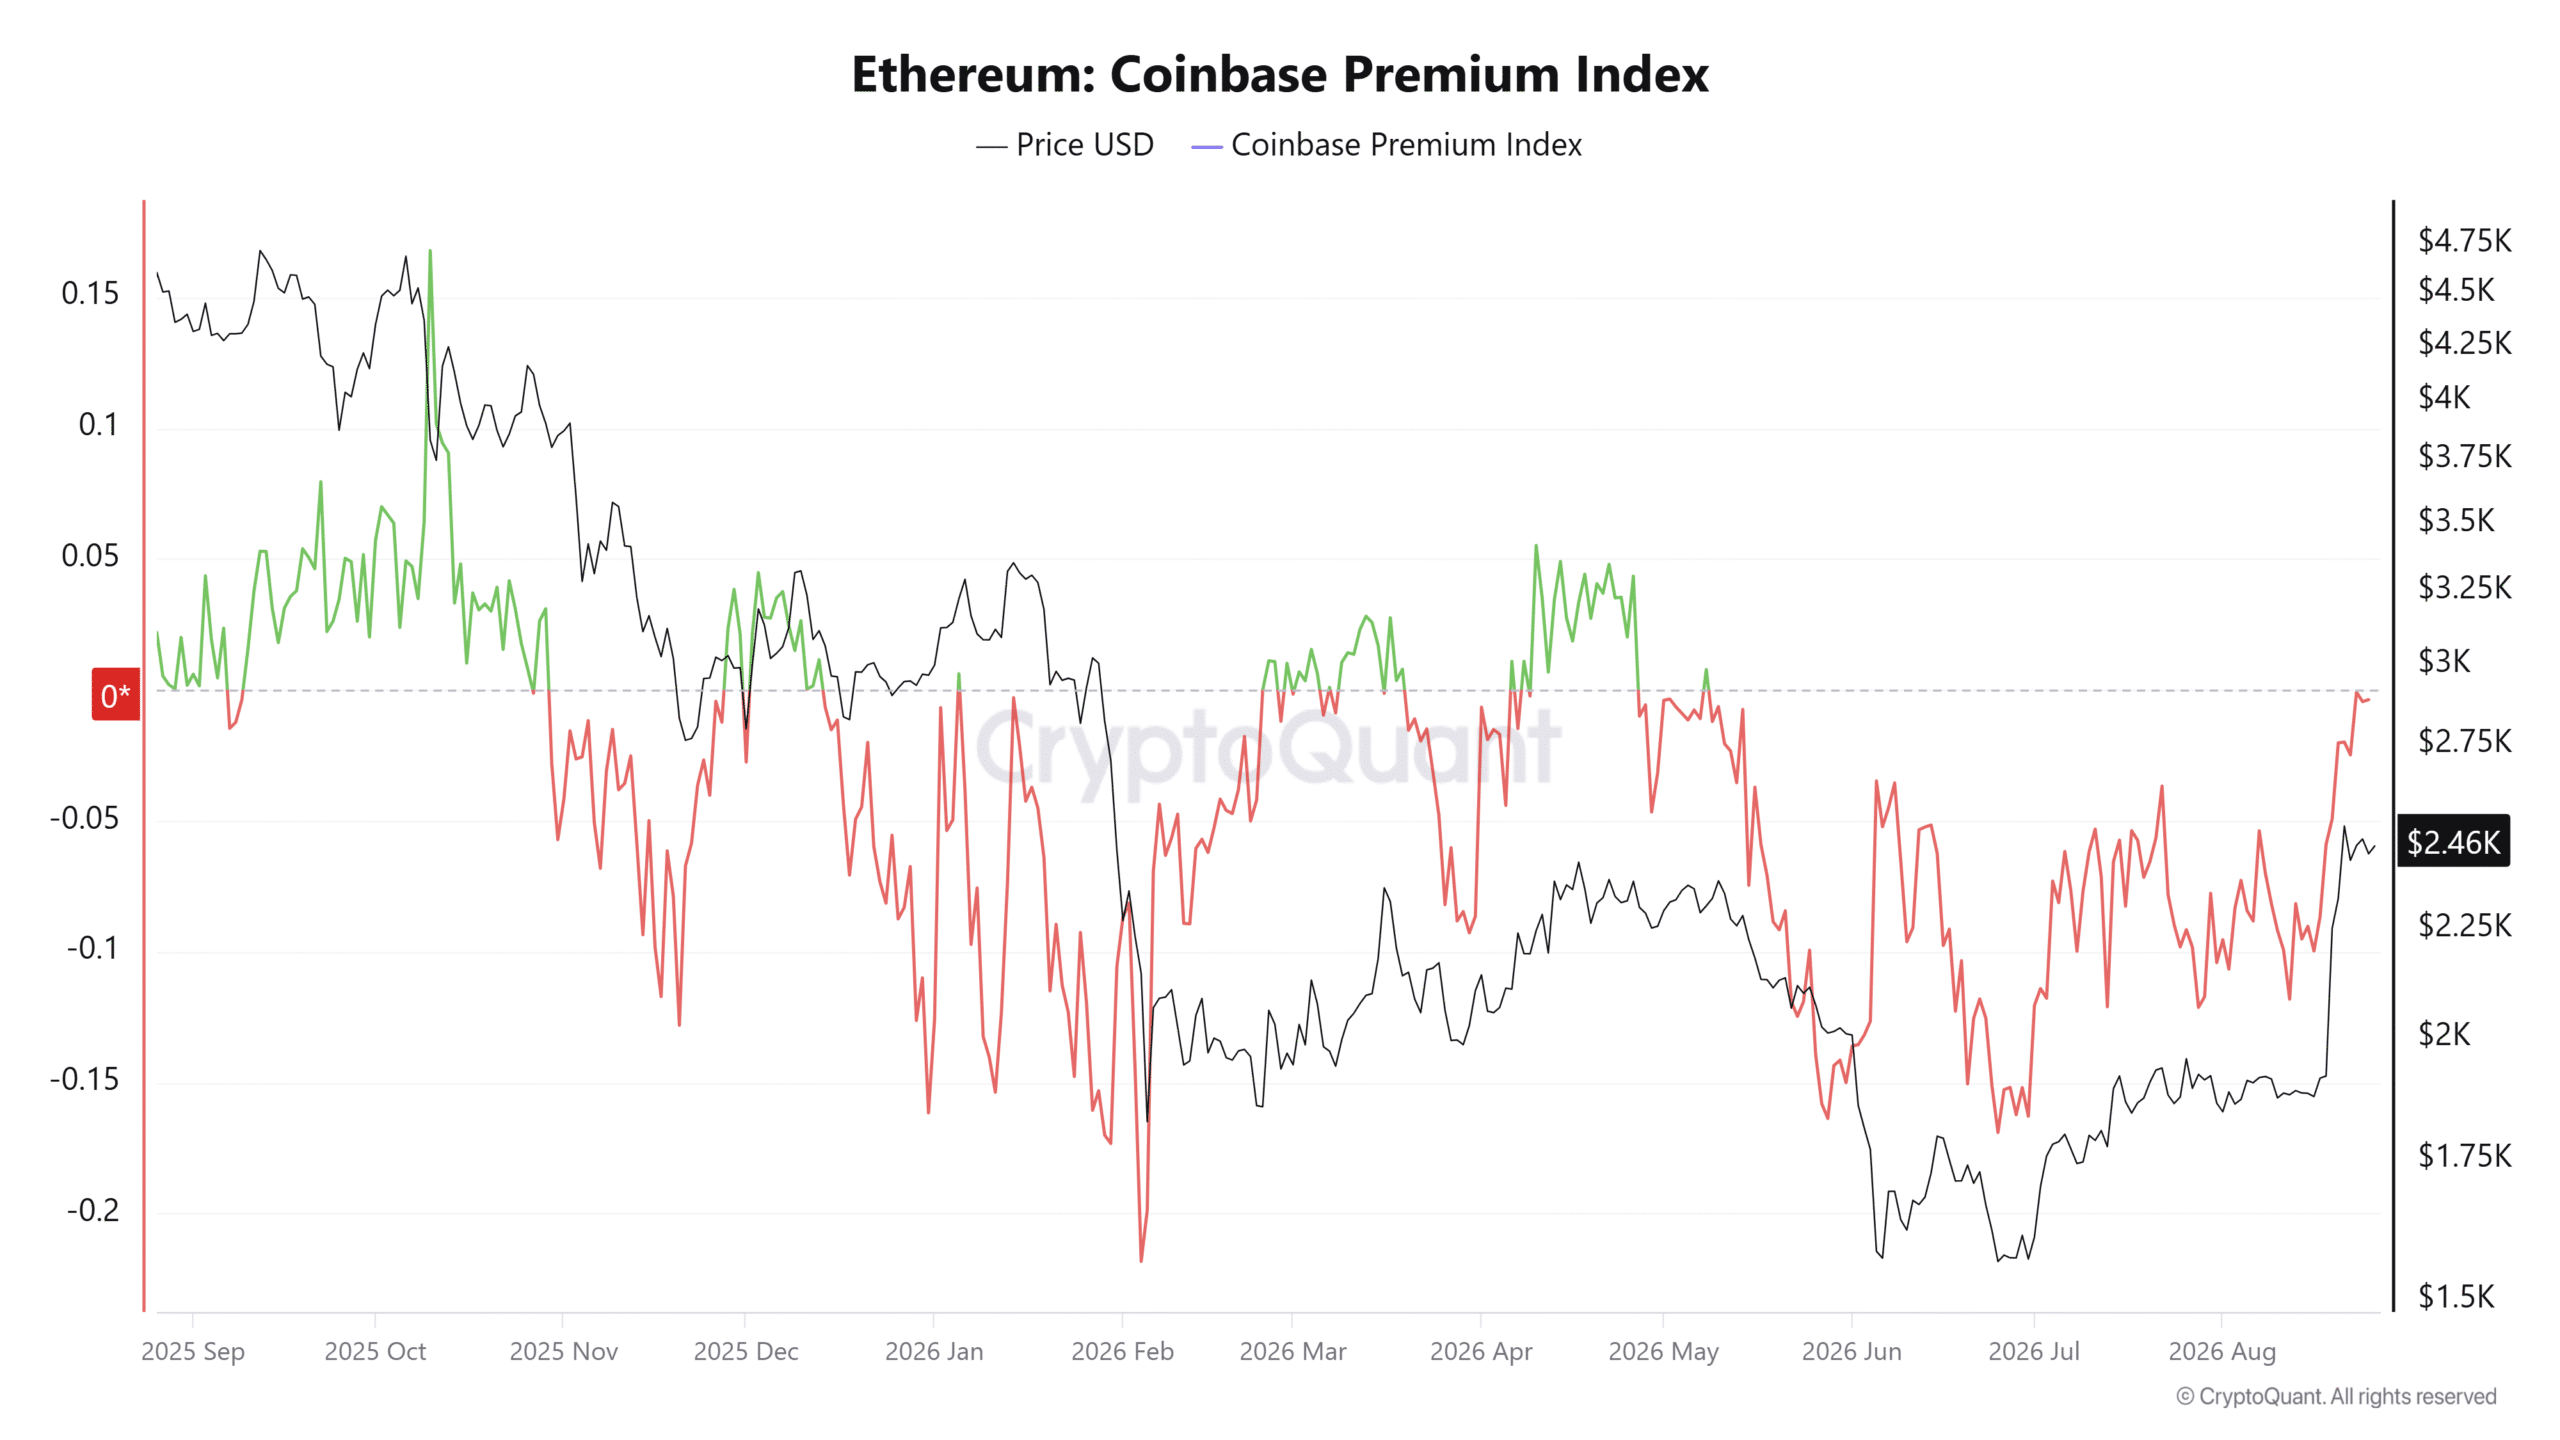
The Coinbase Premium Index was close to zero but not yet in positive territory. A sustained period of CB Premium above zero was last seen in October. At that time, Ethereum had been trading in the $2,200-$2,400 area, the same place it is at right now.
The negative readings in recent months meant that demand from U.S.-based investors was weaker compared to demand on Binance. In the past, prominent ETH bull runs, such as June-July 2025, have been accompanied by strongly positive Coinbase Premium Index readings.
If the $2,400 supply zone ceiling is cleared, it is possible that another such run could commence.
Spot demand helps drive a strong rebound
Crypto intelligence platform Alphractal pointed out that the current Ethereum investor price was at around $1,700. This is defined as the average acquisition price of ETH held by economically active investors.
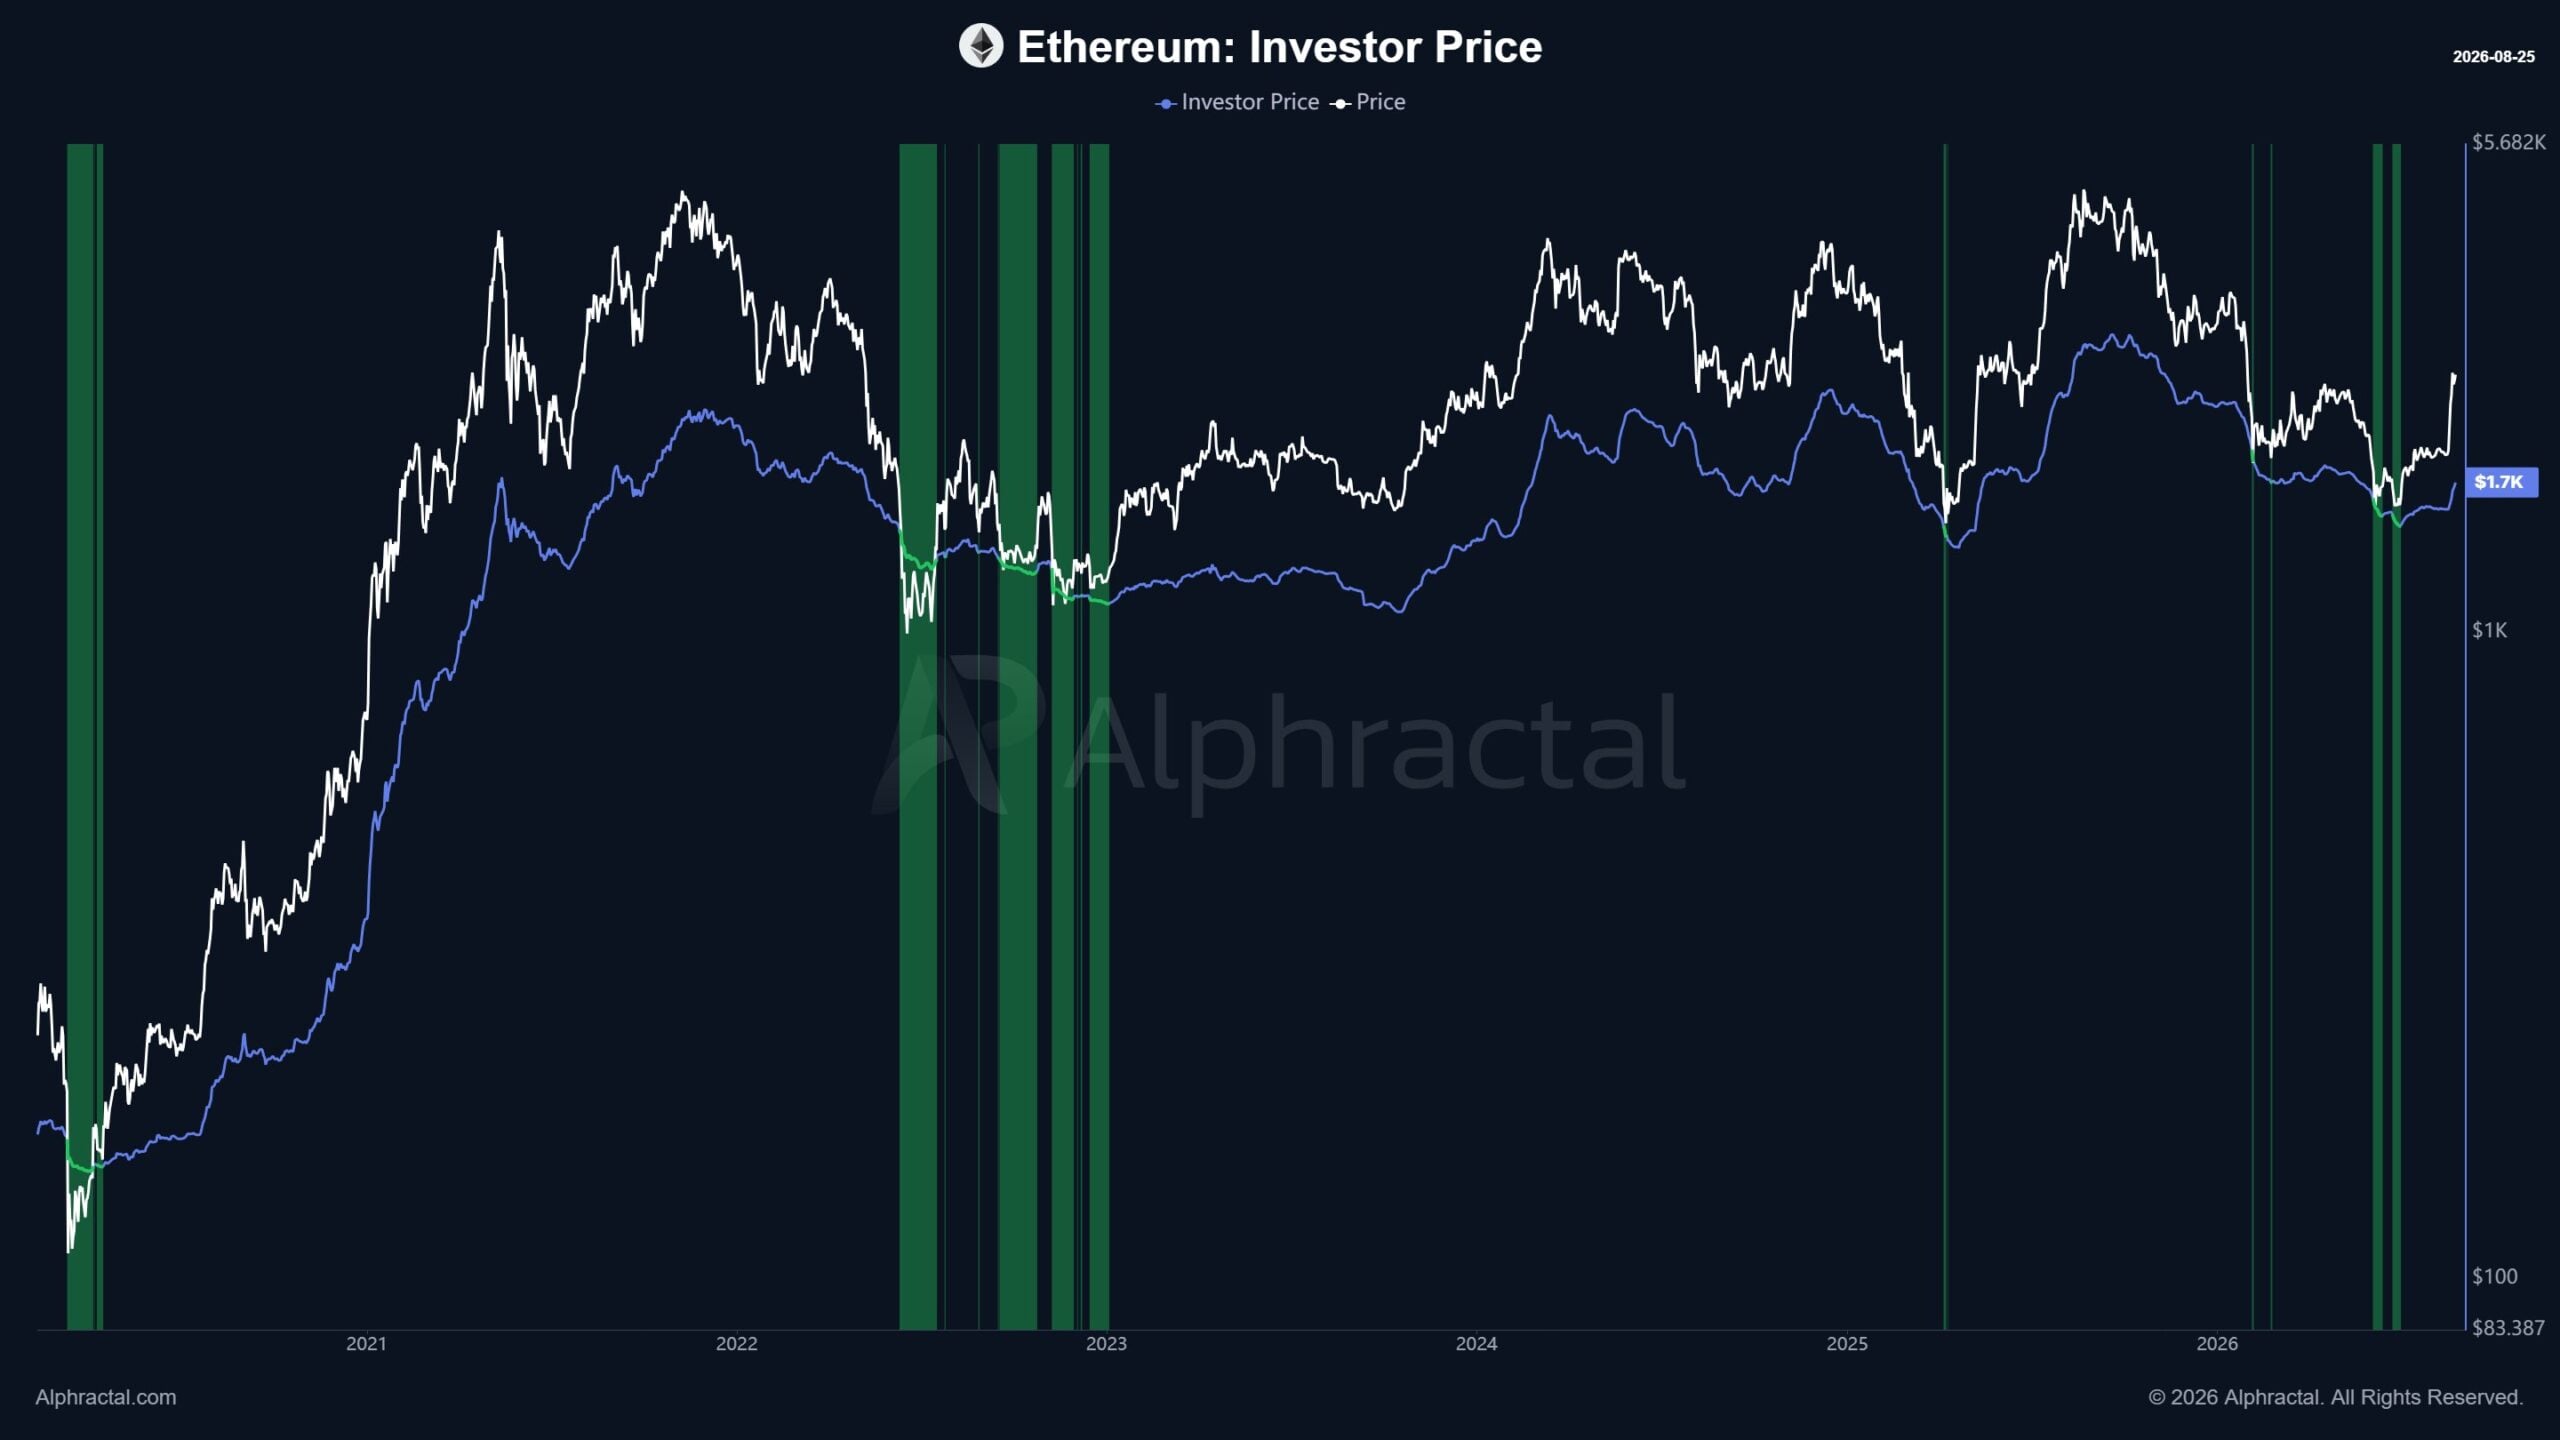
The chart above shows that, after testing the investor price in June, ETH prices have made a decisive rally. Historically, touches of this level, or dips below it, have represented major accumulation zones.
The positive reaction from this price level was accompanied by strong buying pressure, especially over the past ten days.
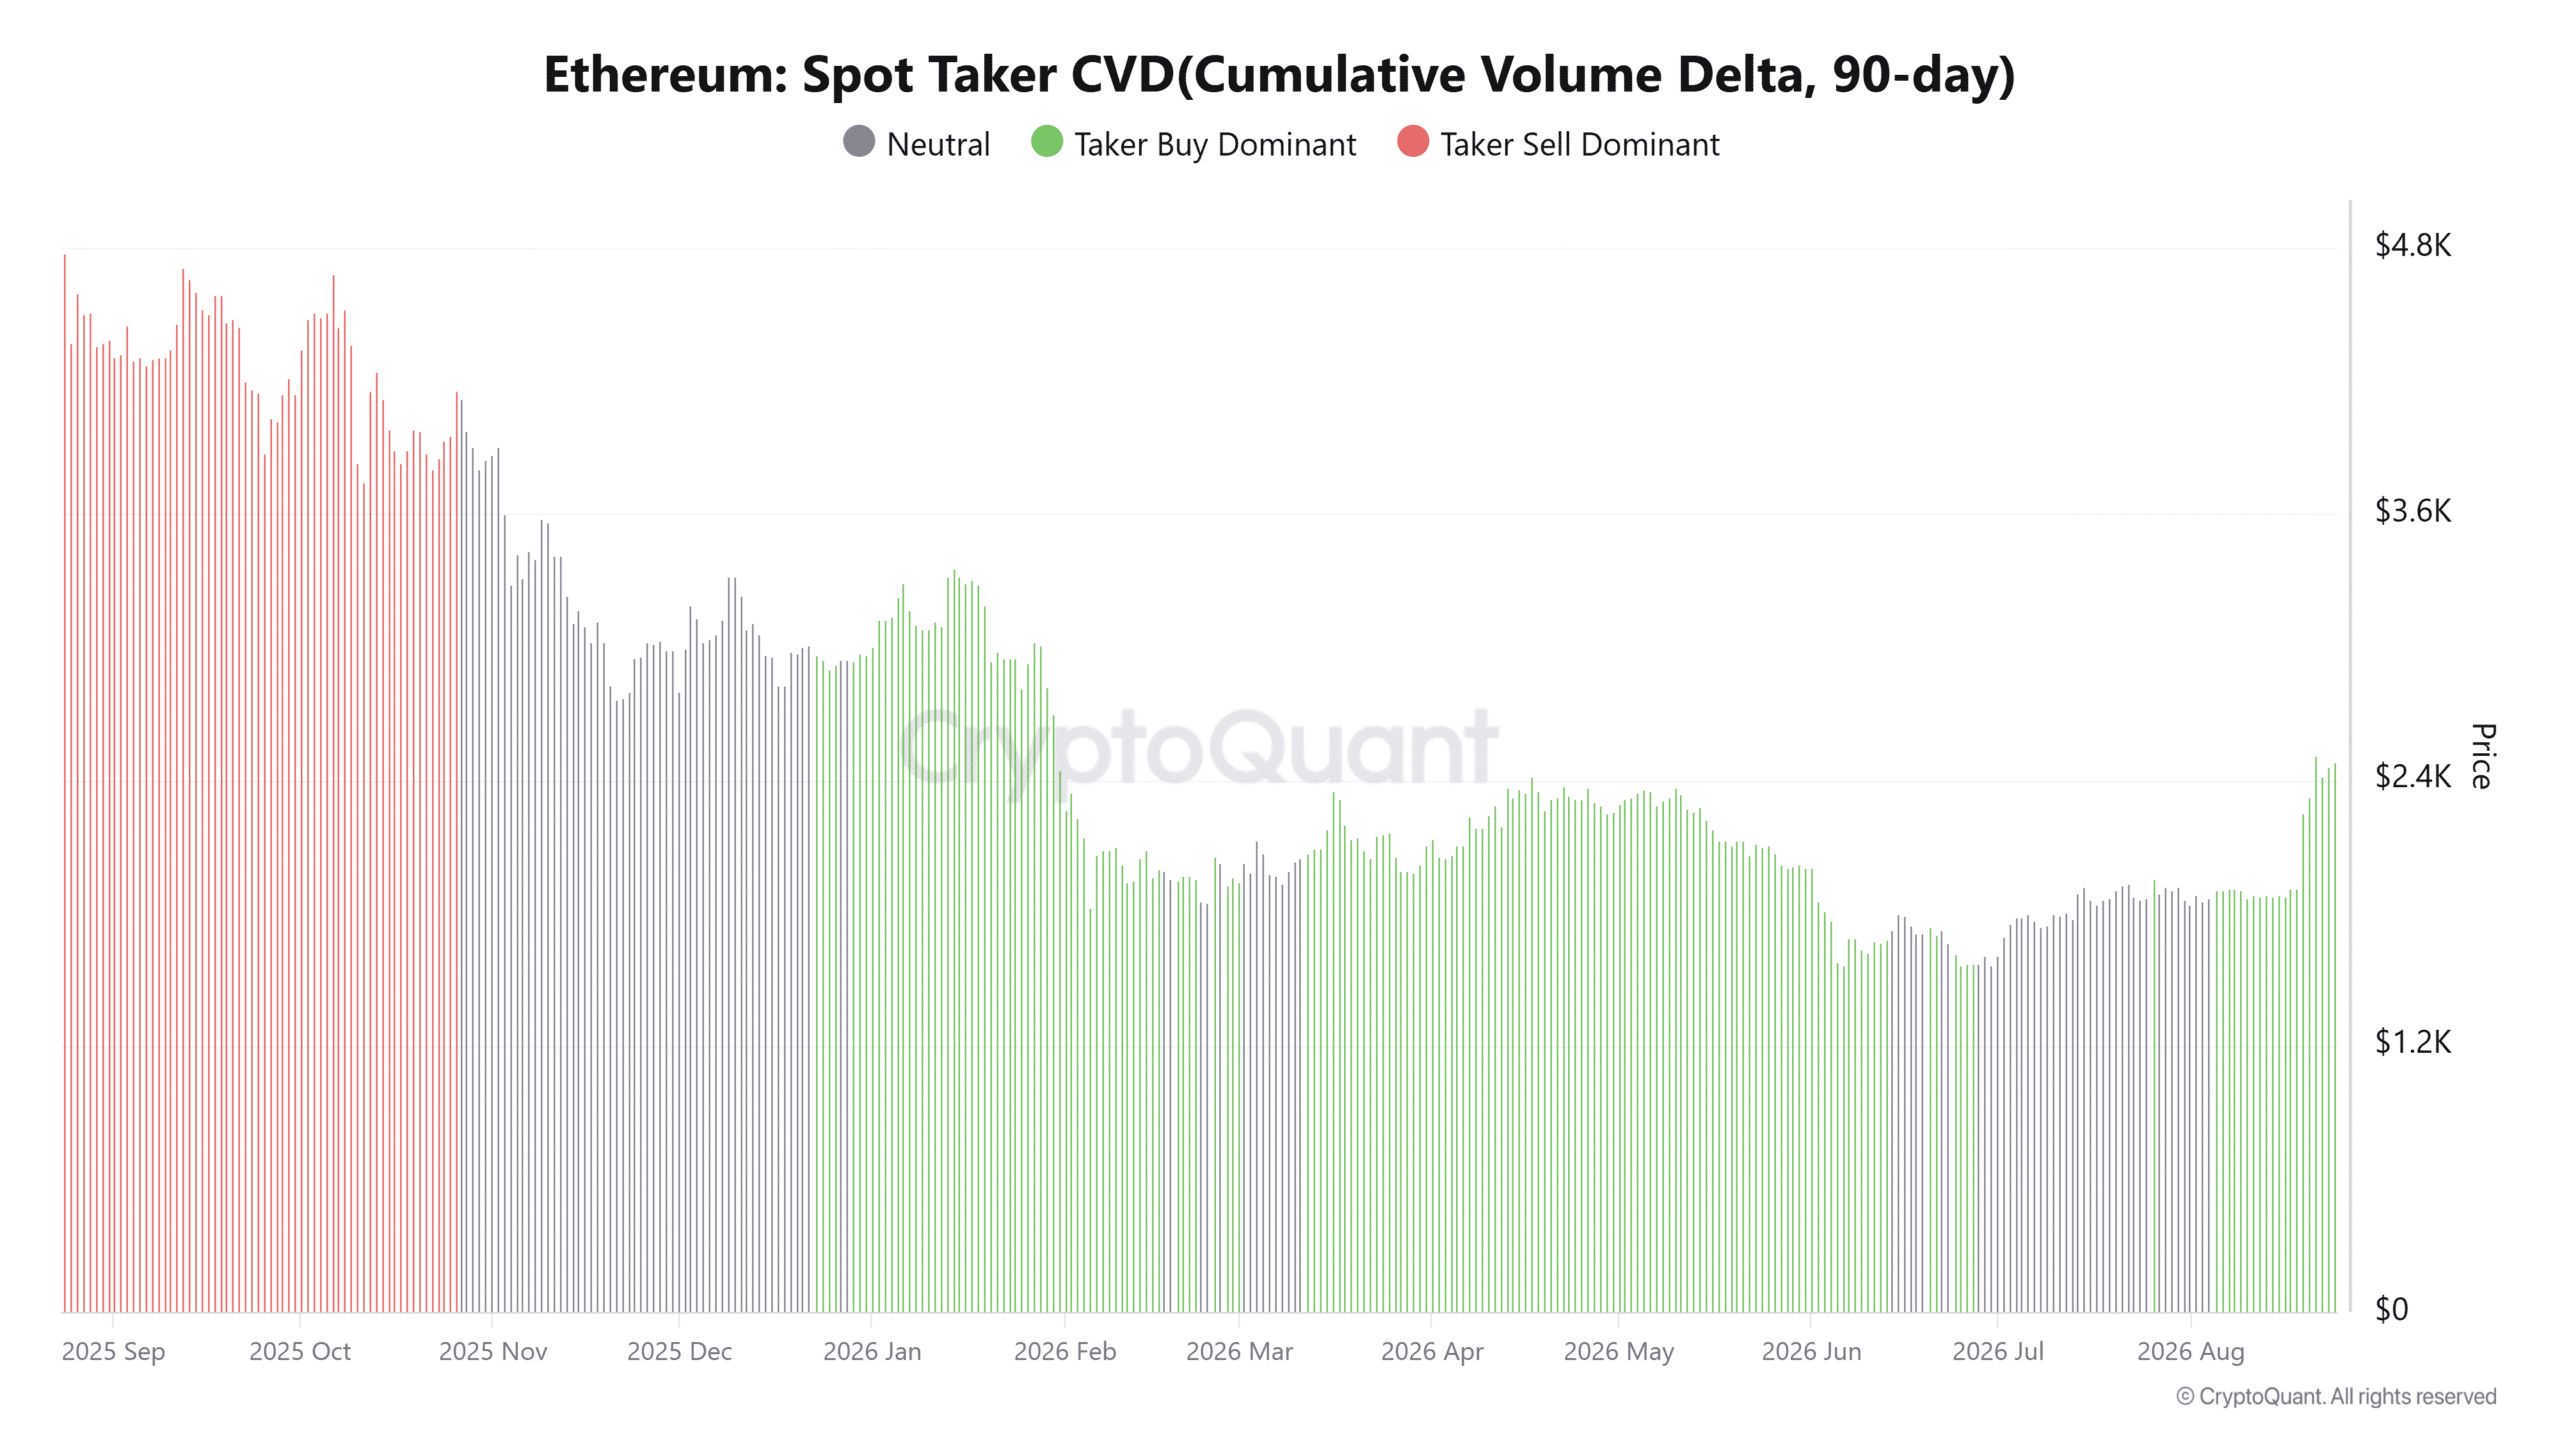
The spot taker CVD measures the 90-day cumulative difference between taker (market order) buy and sell volumes. Rising taker buy orders indicate aggressive demand for the asset. Institutional demand was going strong, too.
A taker buy-dominant phase after a retest of a major accumulation zone is euphoric news for the bulls.
Key supply zone retest could dictate the next trend direction
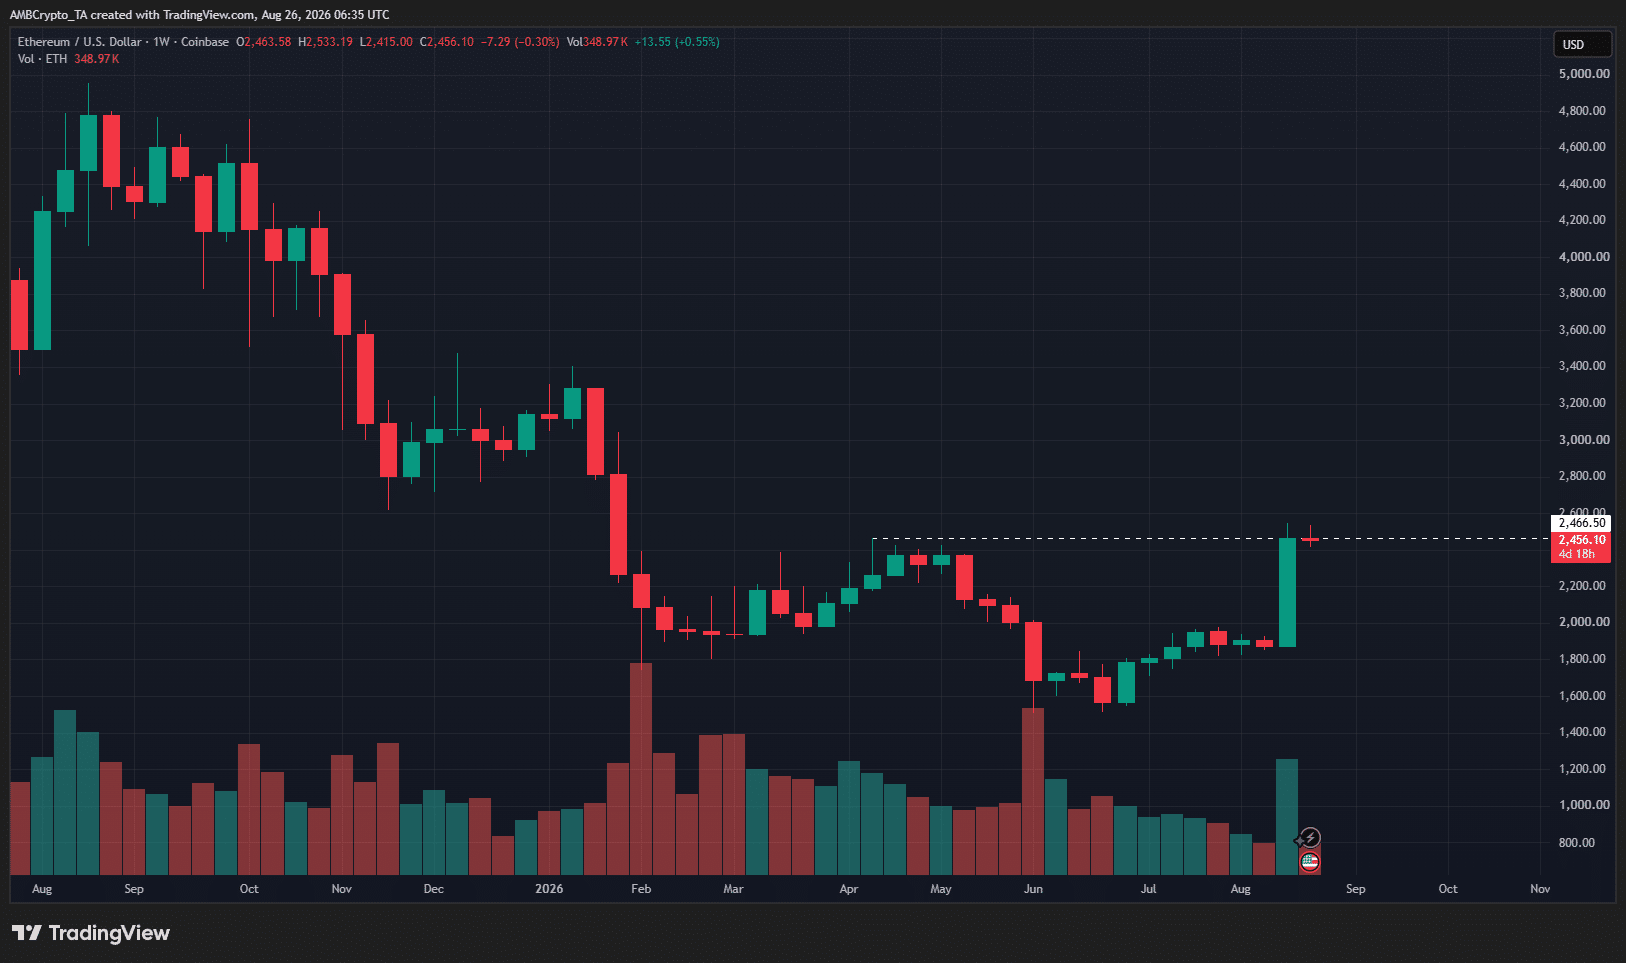
The swing high made at $2,466 in April is under siege once again. So far, despite the past week’s swift gains, a decisive breakout past this supply zone has not occurred yet.
It is possible that the price could sweep these highs before slumping lower once more.
Therefore, holders and swing traders can consider taking partial profits and wait for the market to show its hand.
A breakout past $2,500 would confirm a trend shift, while a rejection and a drop below $2,000 would mean the long-term trend has not yet changed.
Final Summary
- Ethereum exchange reserves were dwindling, and spot taker buying pressure went up a notch within the past two weeks.
- A strong bullish reaction from a major accumulation zone means ETH market sentiment is strong as the price tries to break a key swing resistance level.