Ethereum, Tezos, Synthetix Price Analysis: 25 June

On 25 June, market bears resumed their attack on the recovering cryptocurrency market. This attack was felt by Bitcoin’s price and market cap, with the same mirrored by the altcoin sector too, including the likes of Ethereum, Tezos, and Synthetix.
Ethereum [ETH]

Source: ETHUSD on TradingView
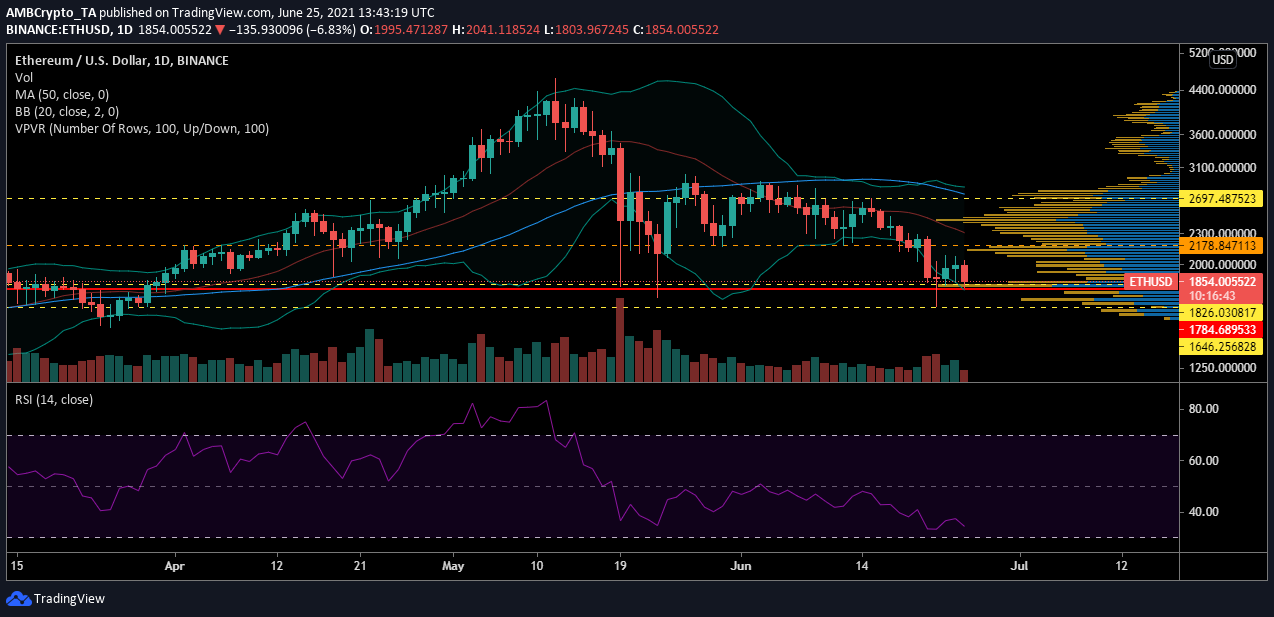
Ethereum’s price was trying to recover over the past couple of days when traders began to push and pull the price at $1,826. It managed to surge to $2,075 on 24 June, however, a subsequent attack from the bears once again pushed the value close to the support at $1,826.
ETH was being traded at $1,857, at the time of writing, and the market remained bearish. Despite the negative pressure, however, traders were engaging highly with the press time price level. The Visible Range Indicator marked the Point of Control at $1,784, a finding that meant that the price could leap to this point and find support once again.
This downtrend could be possible as the selling pressure remained high in the market. The Relative Strength Index had been moving towards the oversold zone over the week and touched a value of 34. As ETH was a couple of steps away from being oversold, it can test the $1,784 support.
Tezos [XTZ]

Source: XTZUSD on TradingView
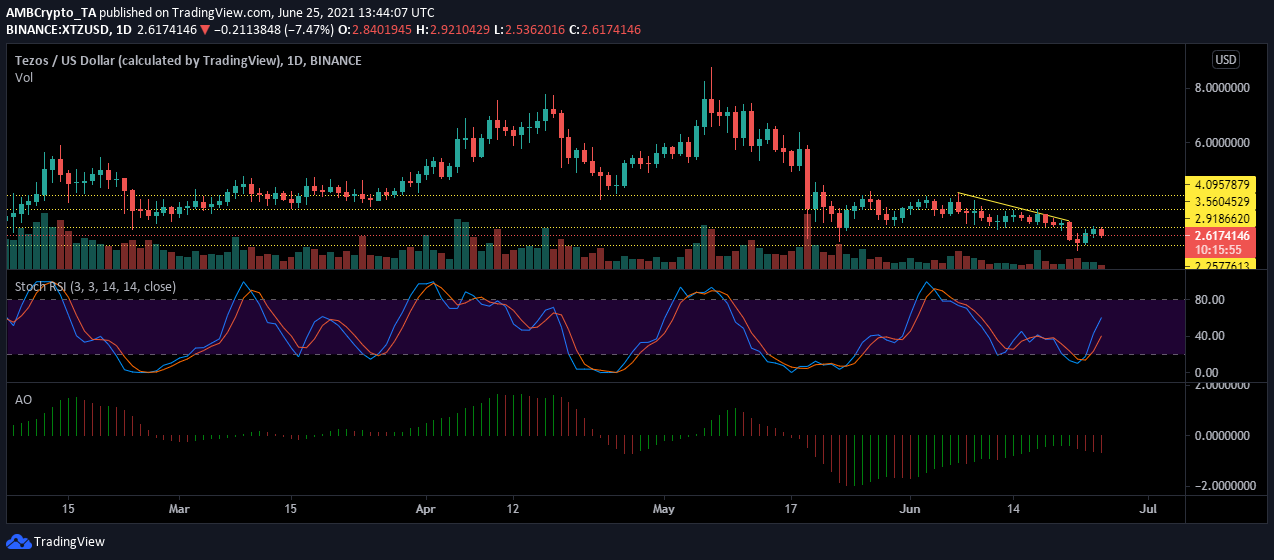
Tezos’s chart seemed to suggest that the asset broke down from a descending channel. It had established support at $2.19, but as the sell-offs caught speed on Monday, the crypto-asset’s price collapsed under the support level. It dropped to $2.07 before taking a U-turn. What’s more, consistent bear attacks have kept XTZ’s value at $2.63.
The aforementioned fall pushed the price away from testing the resistance at $2.91 and added negative momentum to the market. This could keep the price bearish, but as per the Stochastic RSI, the asset was still in the equilibrium zone. This meant that the buying and selling pressures remained equal.
Given the prevailing bearishness, XTZ may continue to consolidate between its immediate resistance and support levels.
Synthetix [SNX]

Source: SNXUSD on TradingView
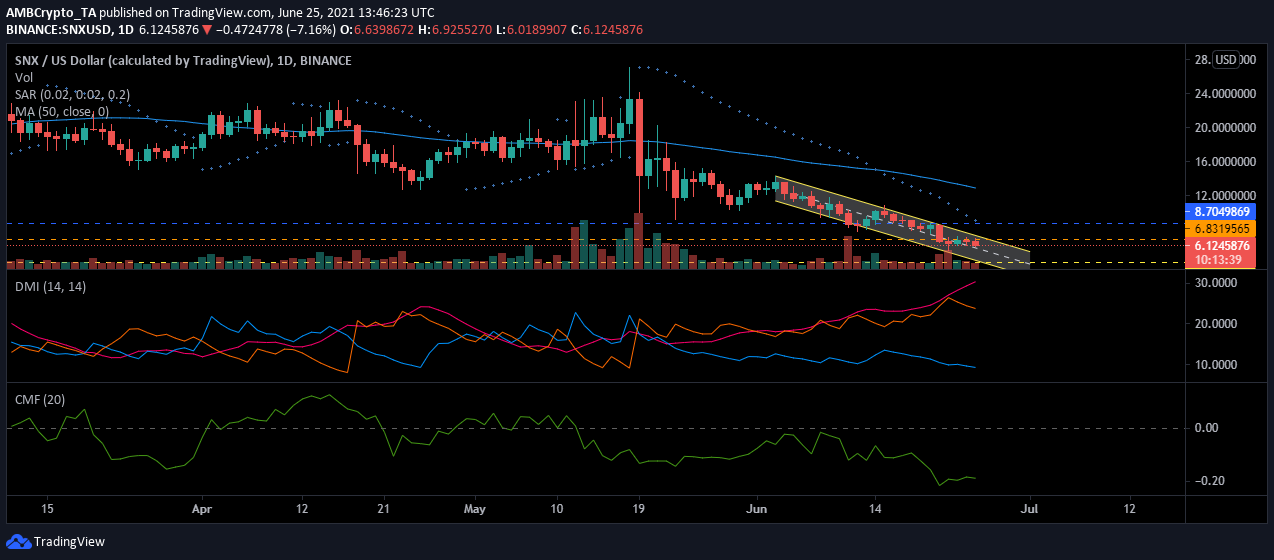
Synthetix’s price has been dropping sharply within a descending channel and has not yet found stable support. The market has taken a turn for extreme bearishness as the market indicators were reaching extremes.
The downward pressure was marked by the Parabolic SAR as its markers were found above the price bars. Meanwhile, the Directional Movement Index confirmed the southbound pressure evident in the market. As the -DI further diverged from the +DI, it was a sign of rising selling pressure in the SNX market.
As the price failed to hold on to any support points, it may be moving towards the support at $4.15. However, SNX has not seen this value since January 2021. This is possible as the selling pressure has been maintained. The Chaikin Money Flow indicator has remained out of money since May and dropped to -0.19.


