Ethereum – The key to ETH bulls regrouping will be…
Sellers extended their dominance, with bulls unable to rebound after sharp reversal from $2,000 psychological level.

Disclaimer: The information presented does not constitute financial, investment, trading, or other types of advice and is solely the writer’s opinion.
- Sellers extended bearish dominance as prices remained under $1,924-resistance level
- Selling pressure highlighted by bearish crossover on MACD
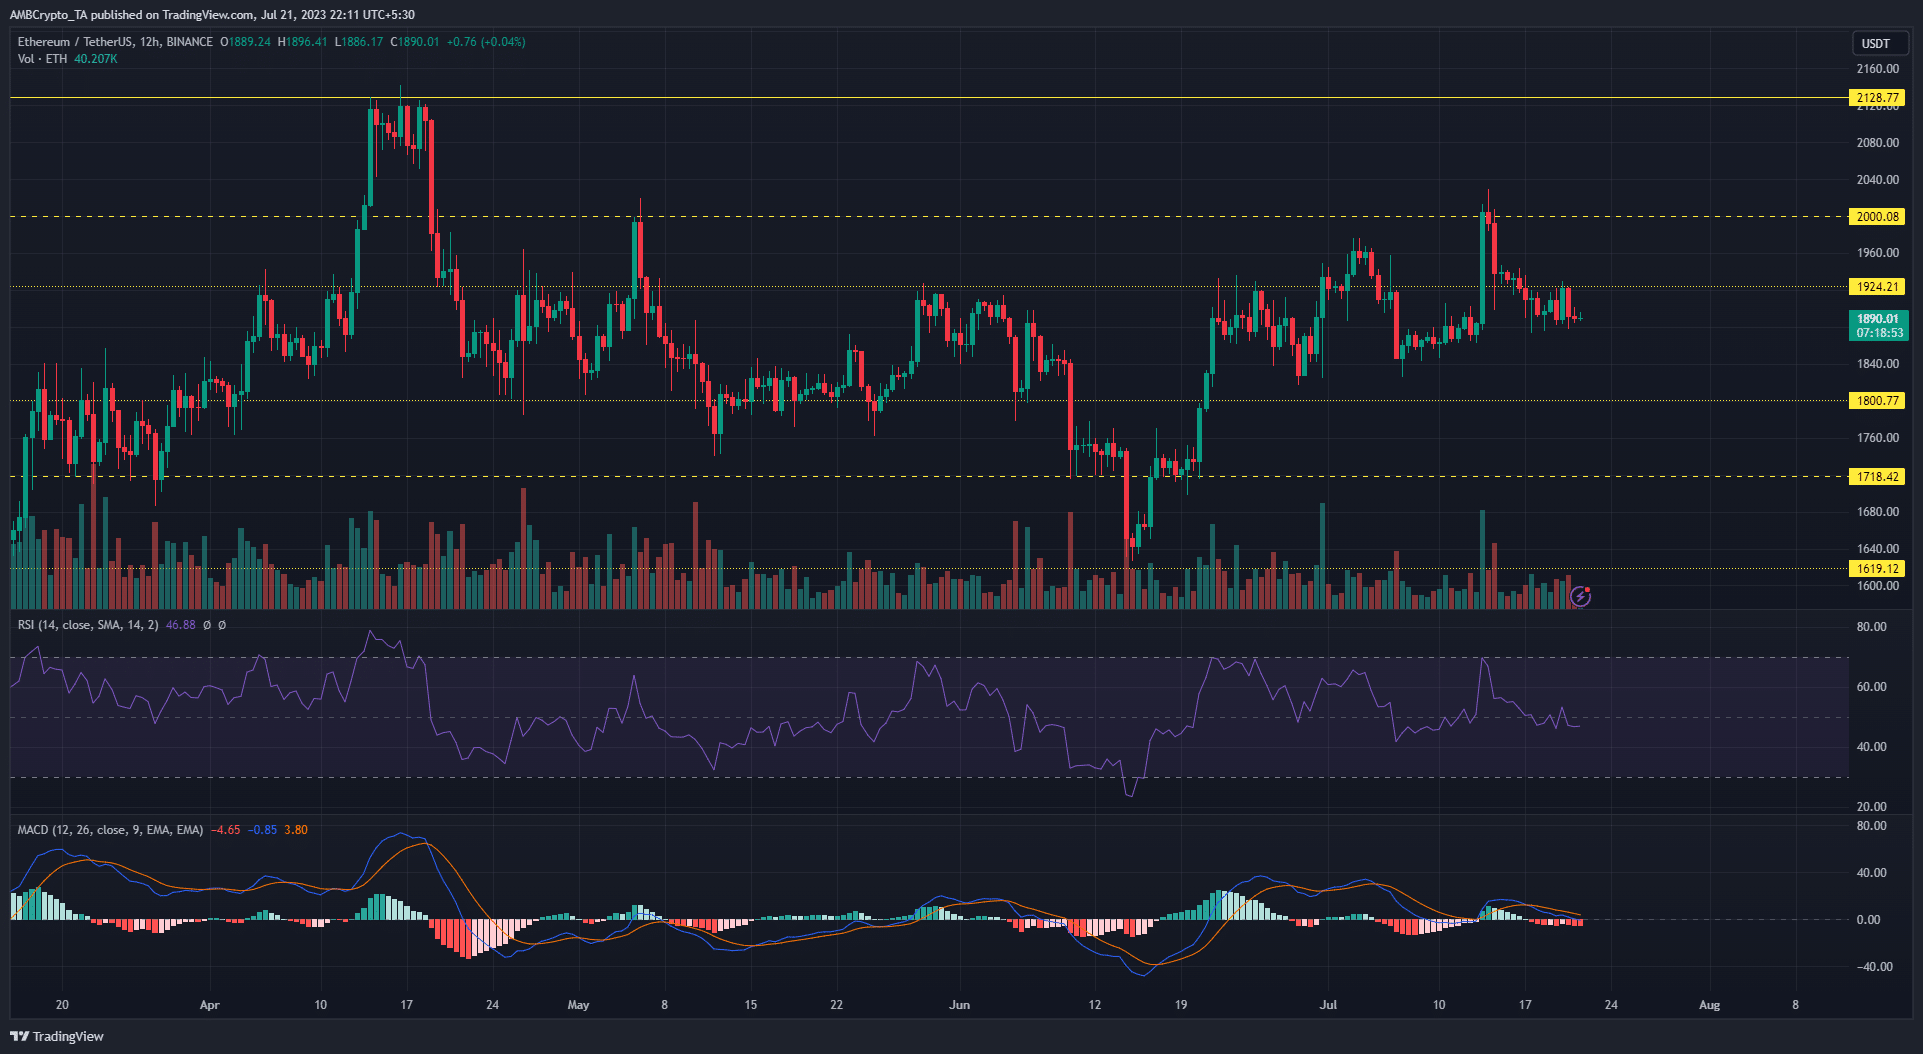
Dwindling market fortunes for bulls saw Ethereum [ETH] sink below the $1,924 support level. The level had previously served as short-term support after ETH was rejected at the $2,000 psychological level on 14 July.
Read Ethereum’s [ETH] Price Prediction 2023-24
The price rejection swung the advantage in favor of sellers, with the rapid decline presenting bears with shorting opportunities. With a general market correction in progress, ETH bulls might need to be cautious as all signs point to more downside.
Bulls caught out by sharp bearish reversal
The significant gains of 13 July which took ETH to the $2,000-mark were taken as a sign of big things expected of the largest altcoin. However, a price report highlighted the danger for bulls around the $1,900 – $1,950 price range.
Bulls’ inability to hold the price at the aforementioned levels extended the bearish dominance, with ETH trading at $1,889 as of press time. Conversely, sellers would be looking to break the higher low of the last bullish rally. A break of this level could see the altcoin sink to $1,800.
Looking at the on-chart indicators on the 12-hour timeframe hinted at further price dips. The Relative Strength Index (RSI) moved under the neutral-50 to highlight the waning demand for ETH. The Moving Average Convergence Divergence (MACD) also recorded a bearish crossover with red bars below the zero level. This highlighted mounting selling pressure.
Shorts can look to enter new positions on a retest of the $1,900 – 1,920 price zone. This sell idea will be invalidated if bulls recover the $1,924-level with a bullish candle close above the resistance.
Contrasting fortunes for short-term and long-term holders
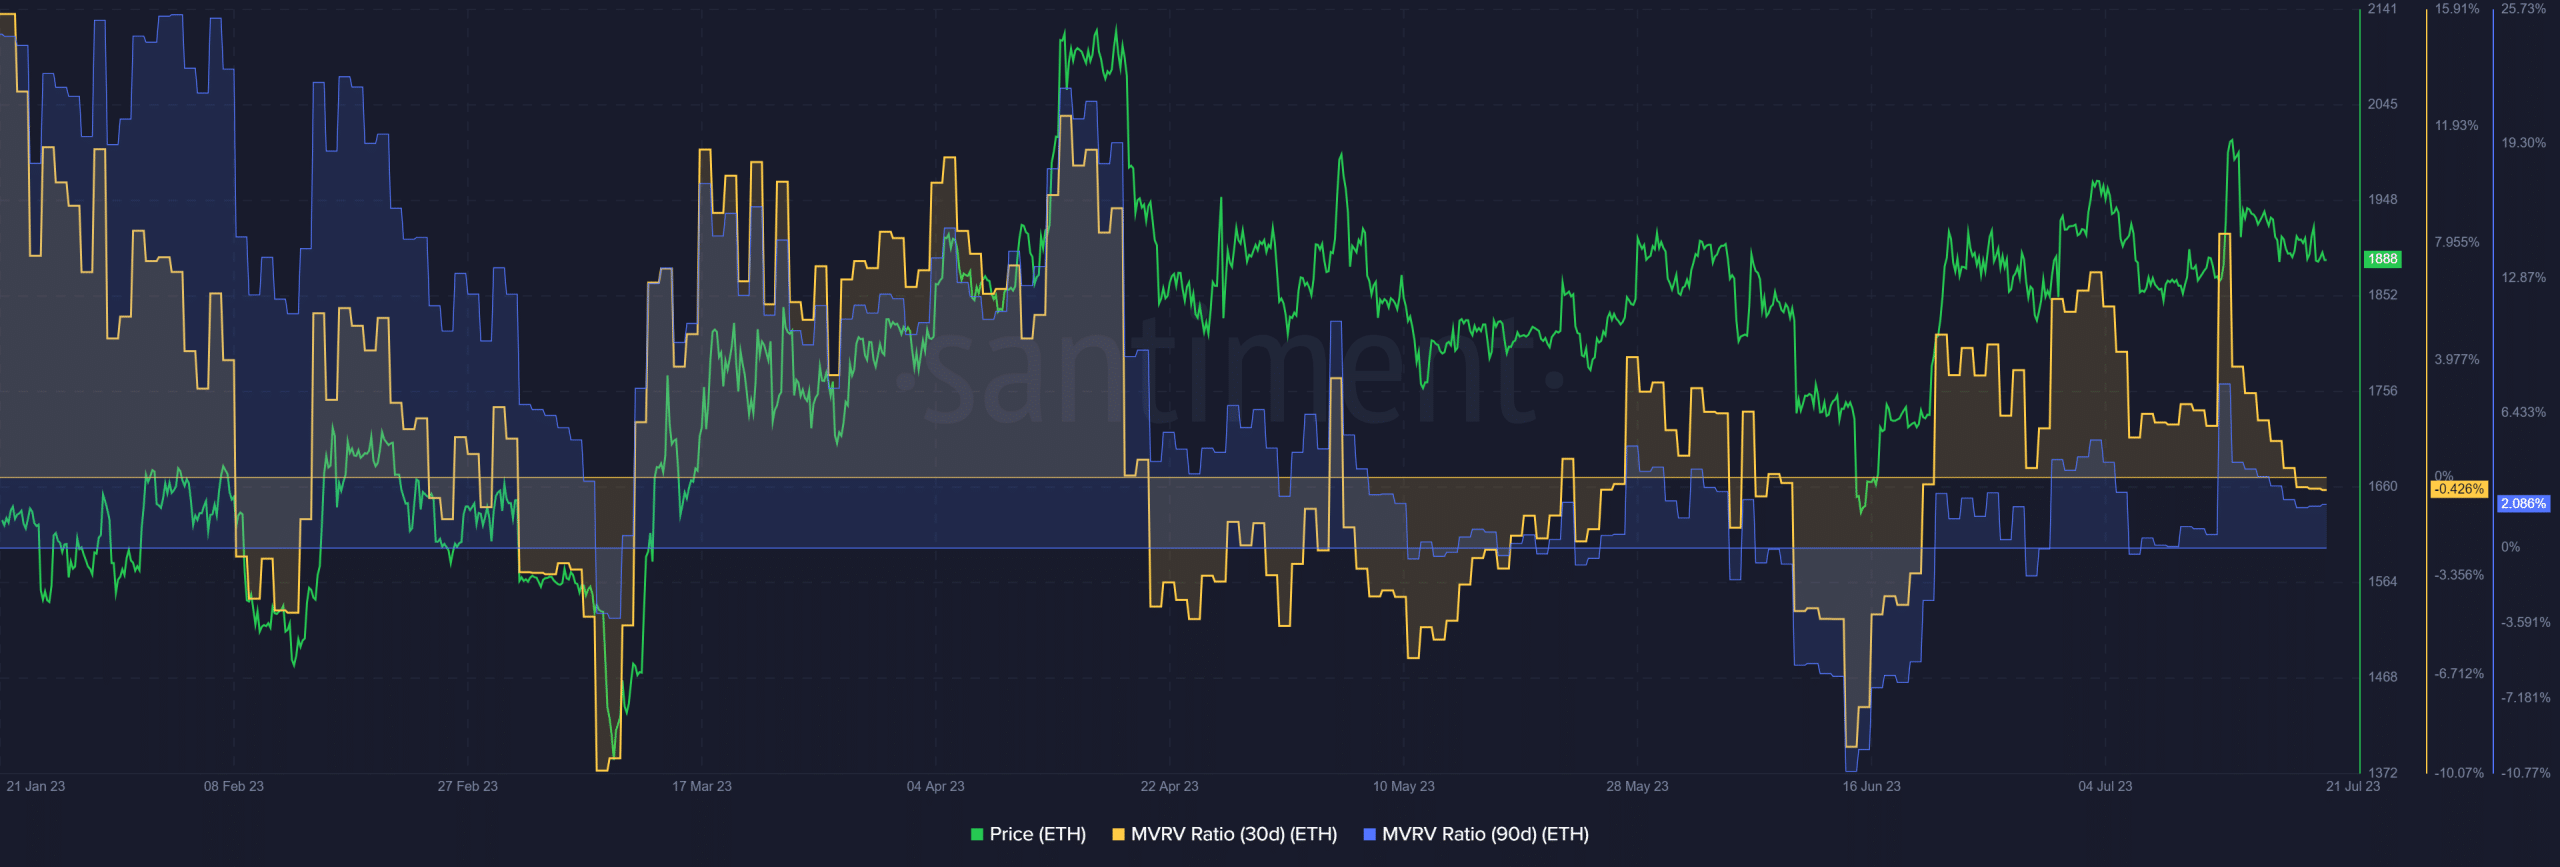
A look at the Market Value to Realized Value Ratio on Santiment revealed the prevalent sentiment among holders. The 30d MVRV ratio stood at -0.42% while the 90d MVRV ratio stood at 2.08%.
How much are 1, 10, or 100 ETH worth today?
This implied that short-term Ethereum holders are still holding onto losses while long-term holders are in profits, albeit marginally. If the bearish momentum continues, long-term holders could look to exit, leading to more downward movement for ETH.


