
- ETH has remained in the $3,200 price range.
- Its RSI showed it was in a bear trend.
Ethereum [ETH] has experienced some price declines recently. However, during this period, there was a noticeable increase in the volume of large transactions.
Data analysis revealed whether this surge in transaction volume was primarily oriented toward buying or selling.
Ethereum sees large transactions
Recently, Ethereum’s large transaction volume reached a monthly peak, exceeding $11.8 billion, according to data from IntoTheBlock.
This spike set the highest level for the month and marked the most significant activity in over two months, the last occurrence being around May.
Currently, the volume has decreased to approximately $3.5 billion. This surge in large transactions coincided with the approval of Ethereum-based Exchange Traded Funds (ETFs).
The approval likely spurred increased activity as institutional investors engaged in substantial trading of the asset.
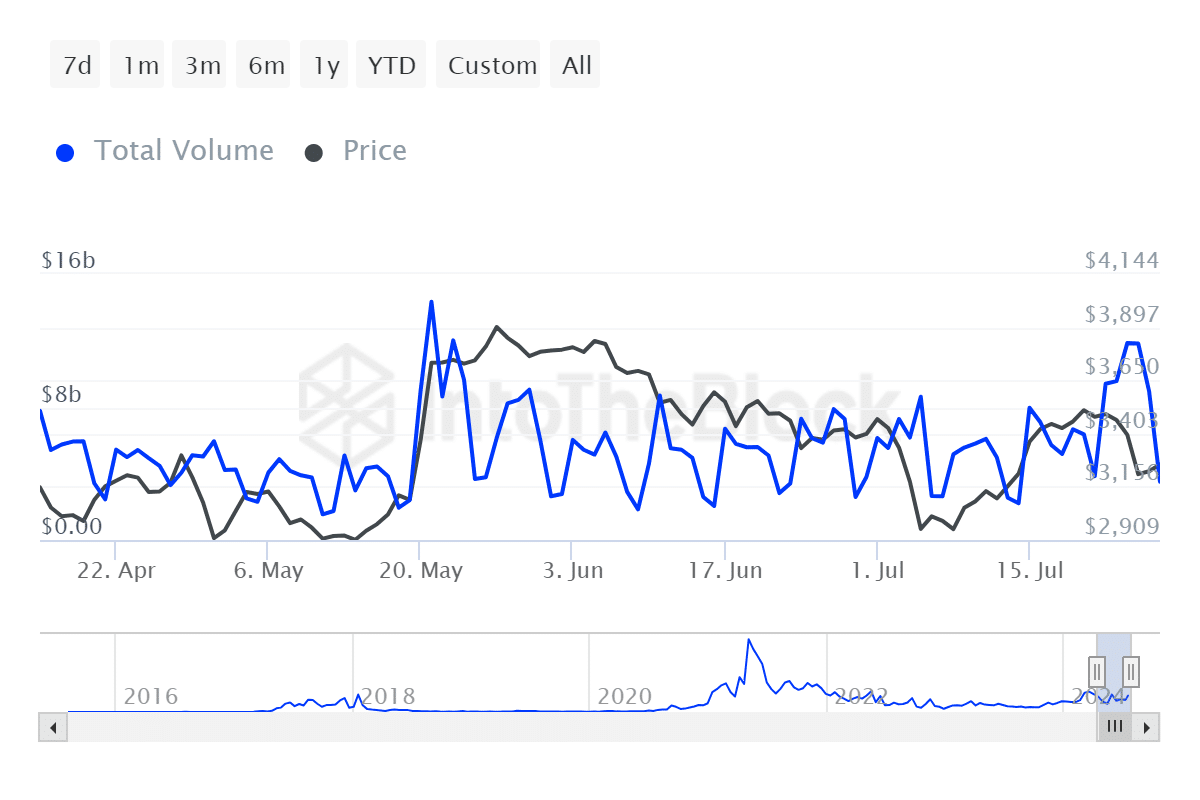
Source: IntoTheBlock
The approval of ETFs generally indicates growing institutional acceptance. It can lead to heightened trading volumes as these entities participate in the market.
What direction is the Ethereum volume going?
The analysis of Ethereum’s exchange netflow for the month, based on data from CryptoQuant, indicates a predominance of positive netflows.
This suggests that more Ethereum (ETH) has been transferred into exchanges than out. This trend typically indicates the preparation of holders to sell their assets.
Also, the dominance is evidenced by spikes in these positive netflows observed throughout July.
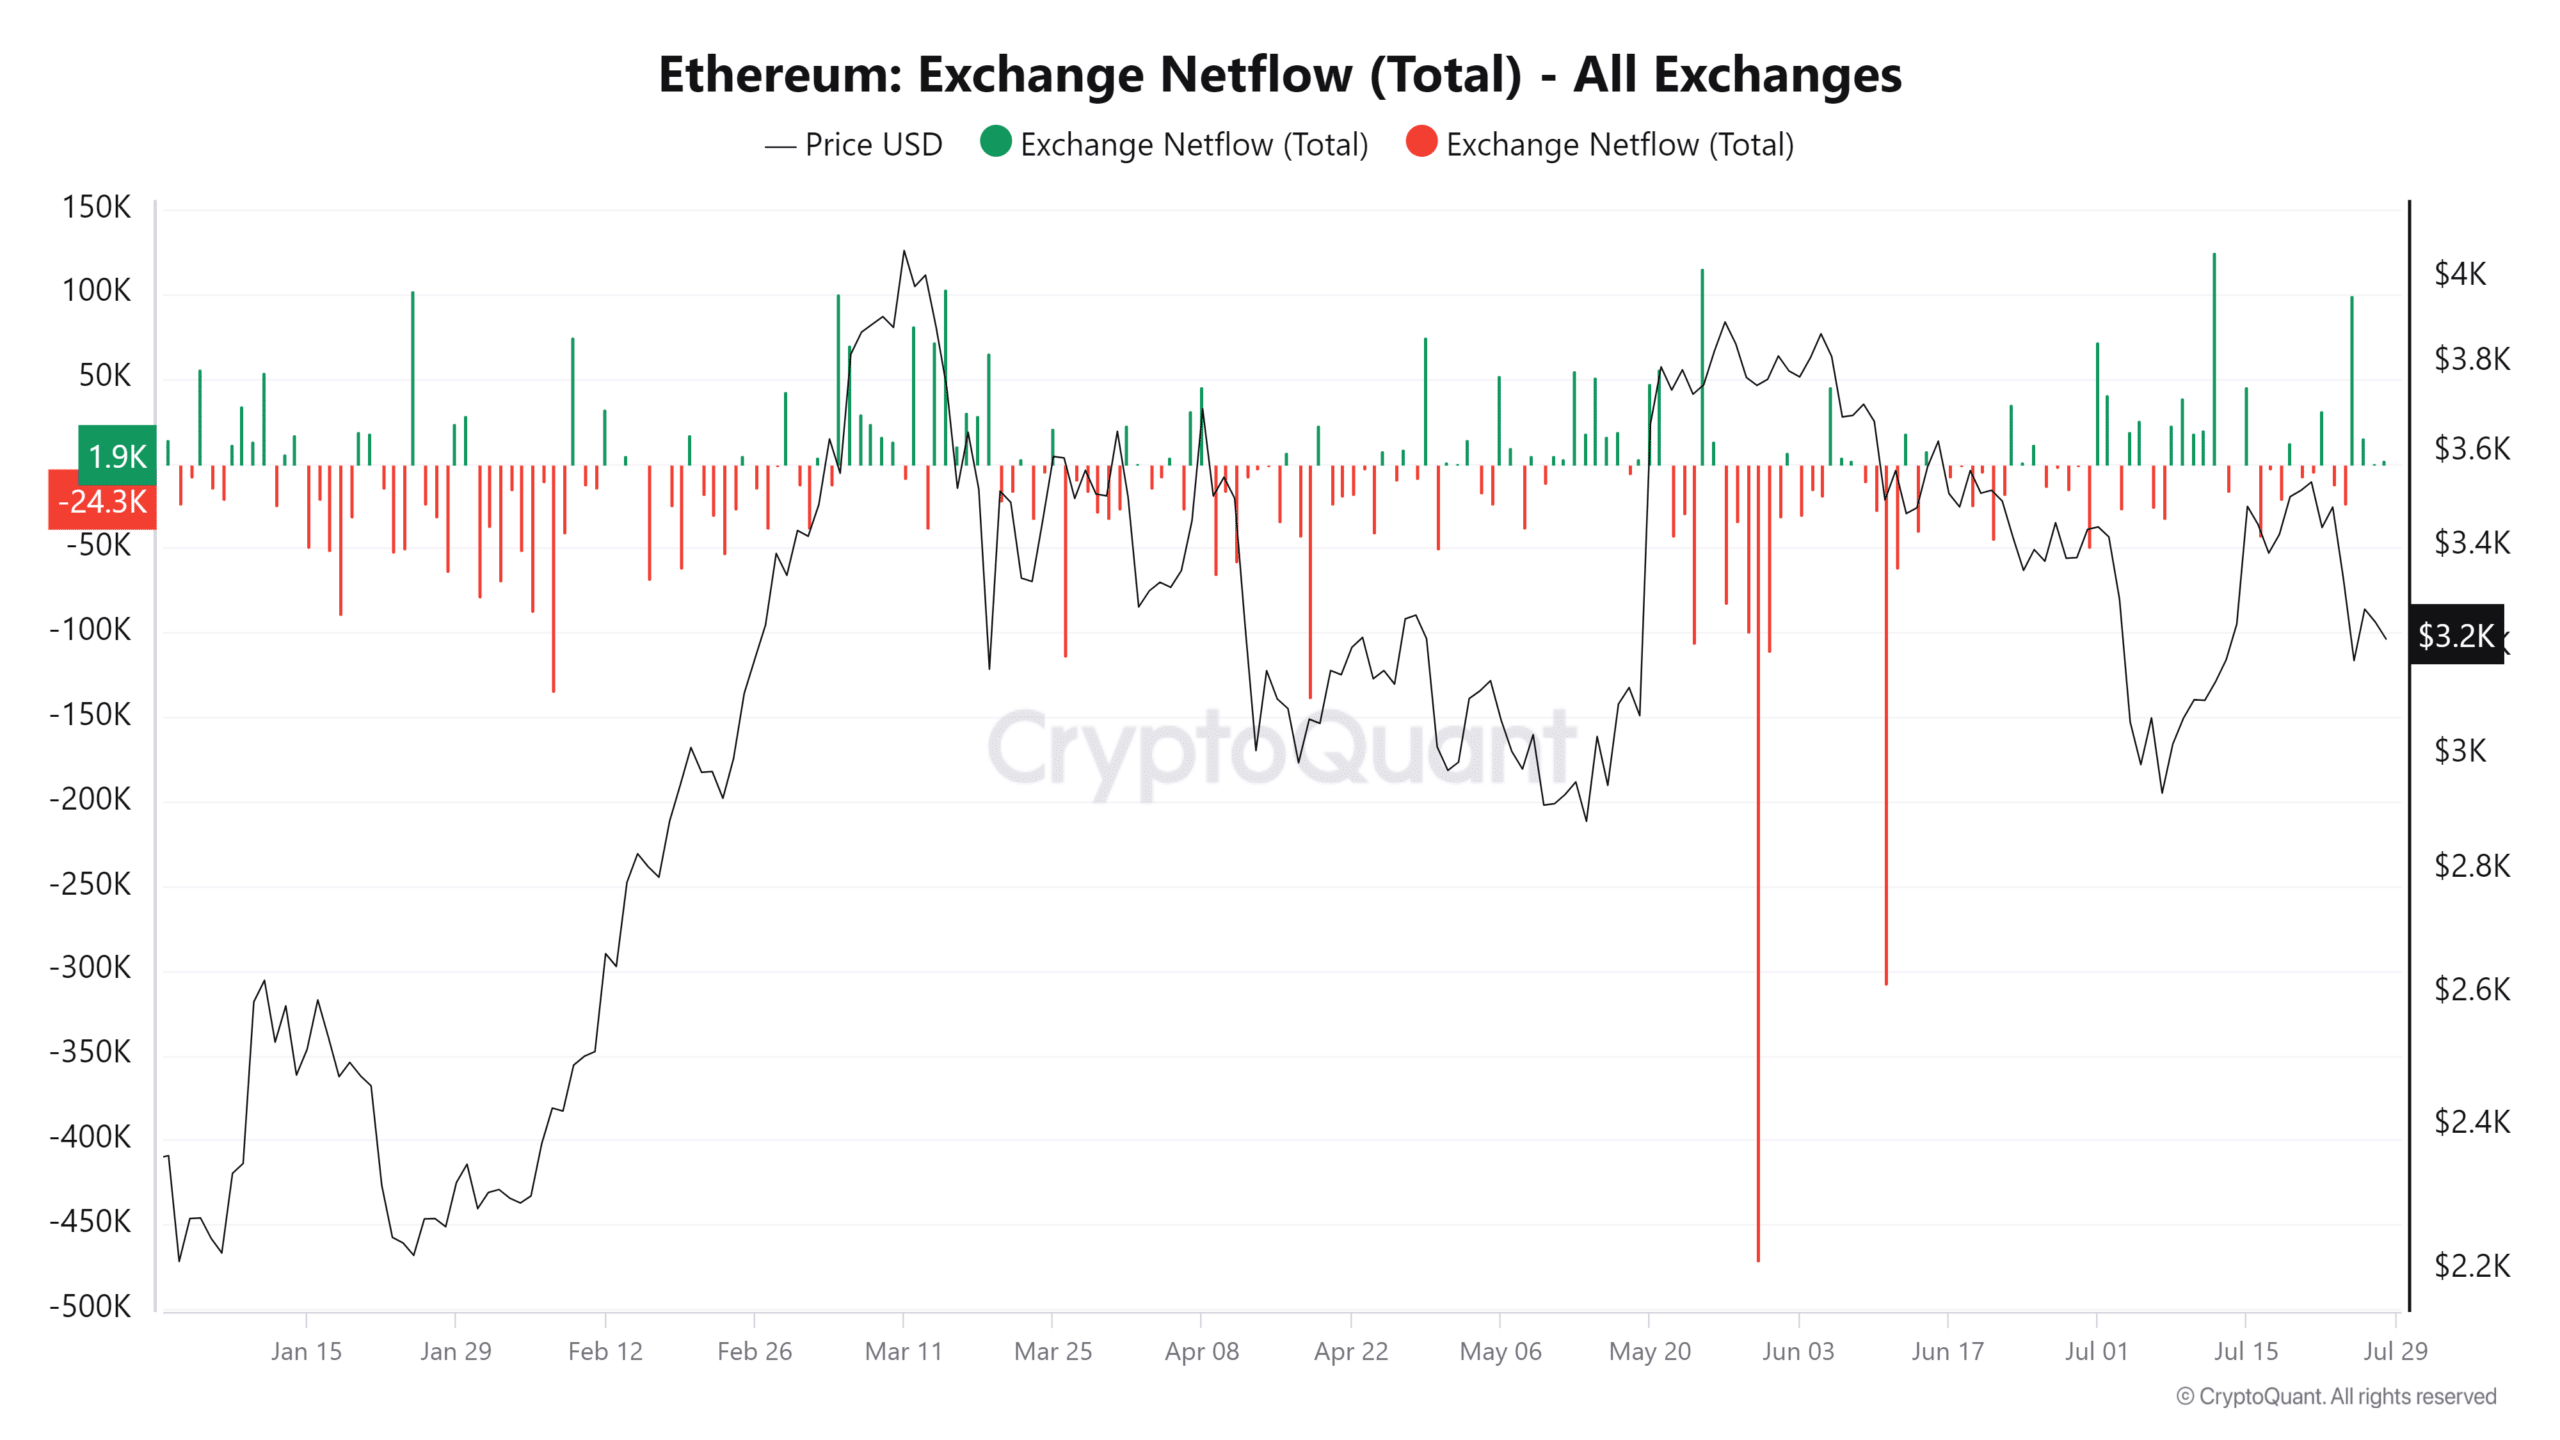
Source: CryptoQuant
As of the latest data, the netflow is close to 2,000, highlighting a recent balance between inflows and outflows.
However, throughout the month, the dynamics have been more volatile; the highest recorded outflow was around -43,000, signifying a substantial withdrawal of ETH from exchanges in a single day, while the highest inflow exceeded 125,000.
ETH sees further drops
Ethereum has been experiencing a downtrend in recent days. According to analysis from AMBCrypto, ETH traded at approximately $3,249 on July 27th, with a decline of less than 1%.
The downward trend has persisted, albeit slightly, with ETH currently trading at around $3,224.
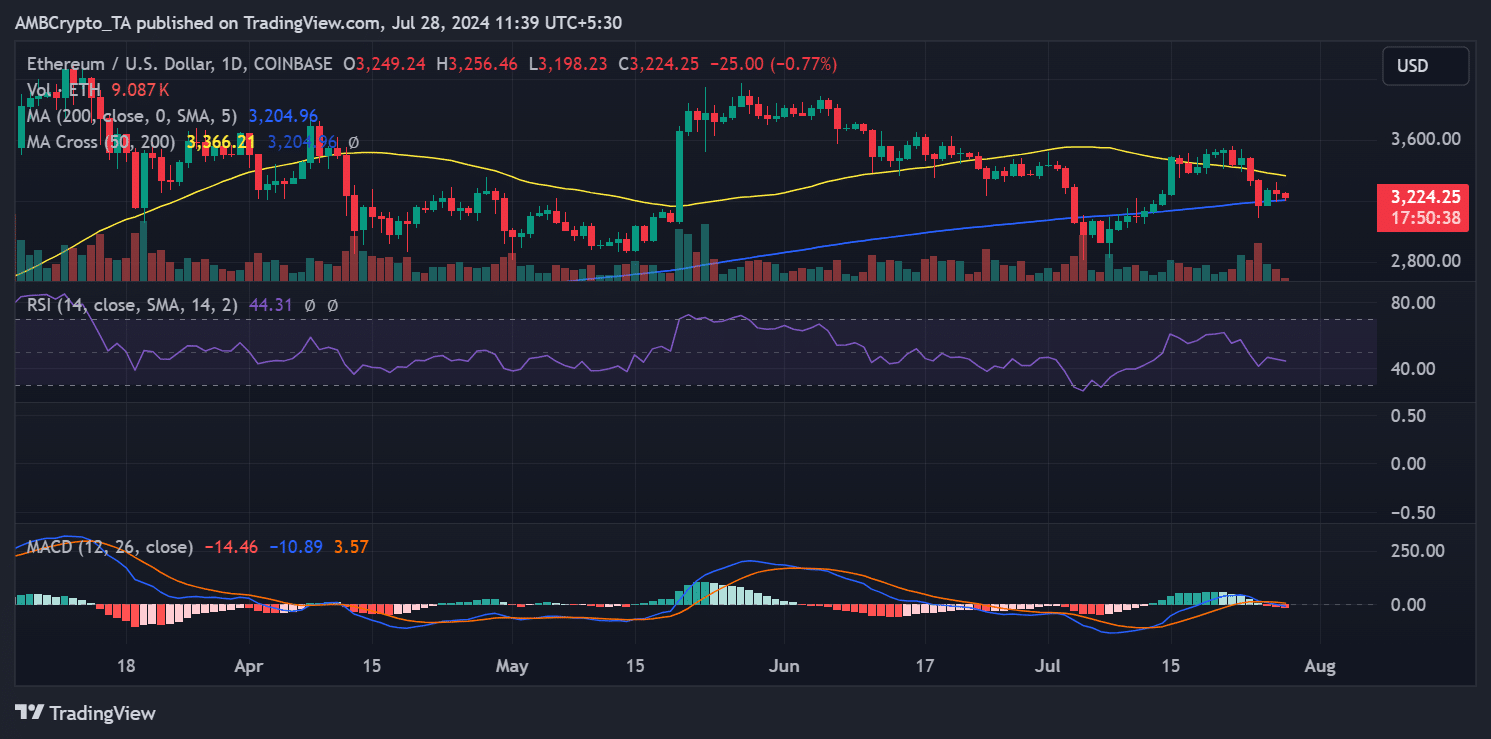
Source: TradingView
Read Ethereum (ETH) Price Prediction 2024-25
Notably, the long moving average (represented by the blue line on the chart) continues to act as a support level.
However, the proximity of the current price to this moving average suggests that Ethereum is close to breaking below this critical support, which could indicate a potential shift in the longer-term market trend.