Ethereum validators stay put – Where does that leave ETH’s price?
ETH’s low price has stopped the validators from exiting the network.

- Voluntary exit on Ethereum fell to a one-month low.
- Despite last week’s price rally, bearish sentiments remain significant in the ETH market.
The daily count of validators exiting the Ethereum [ETH] network recently cratered to a 30-day low, data from Glassnode showed.
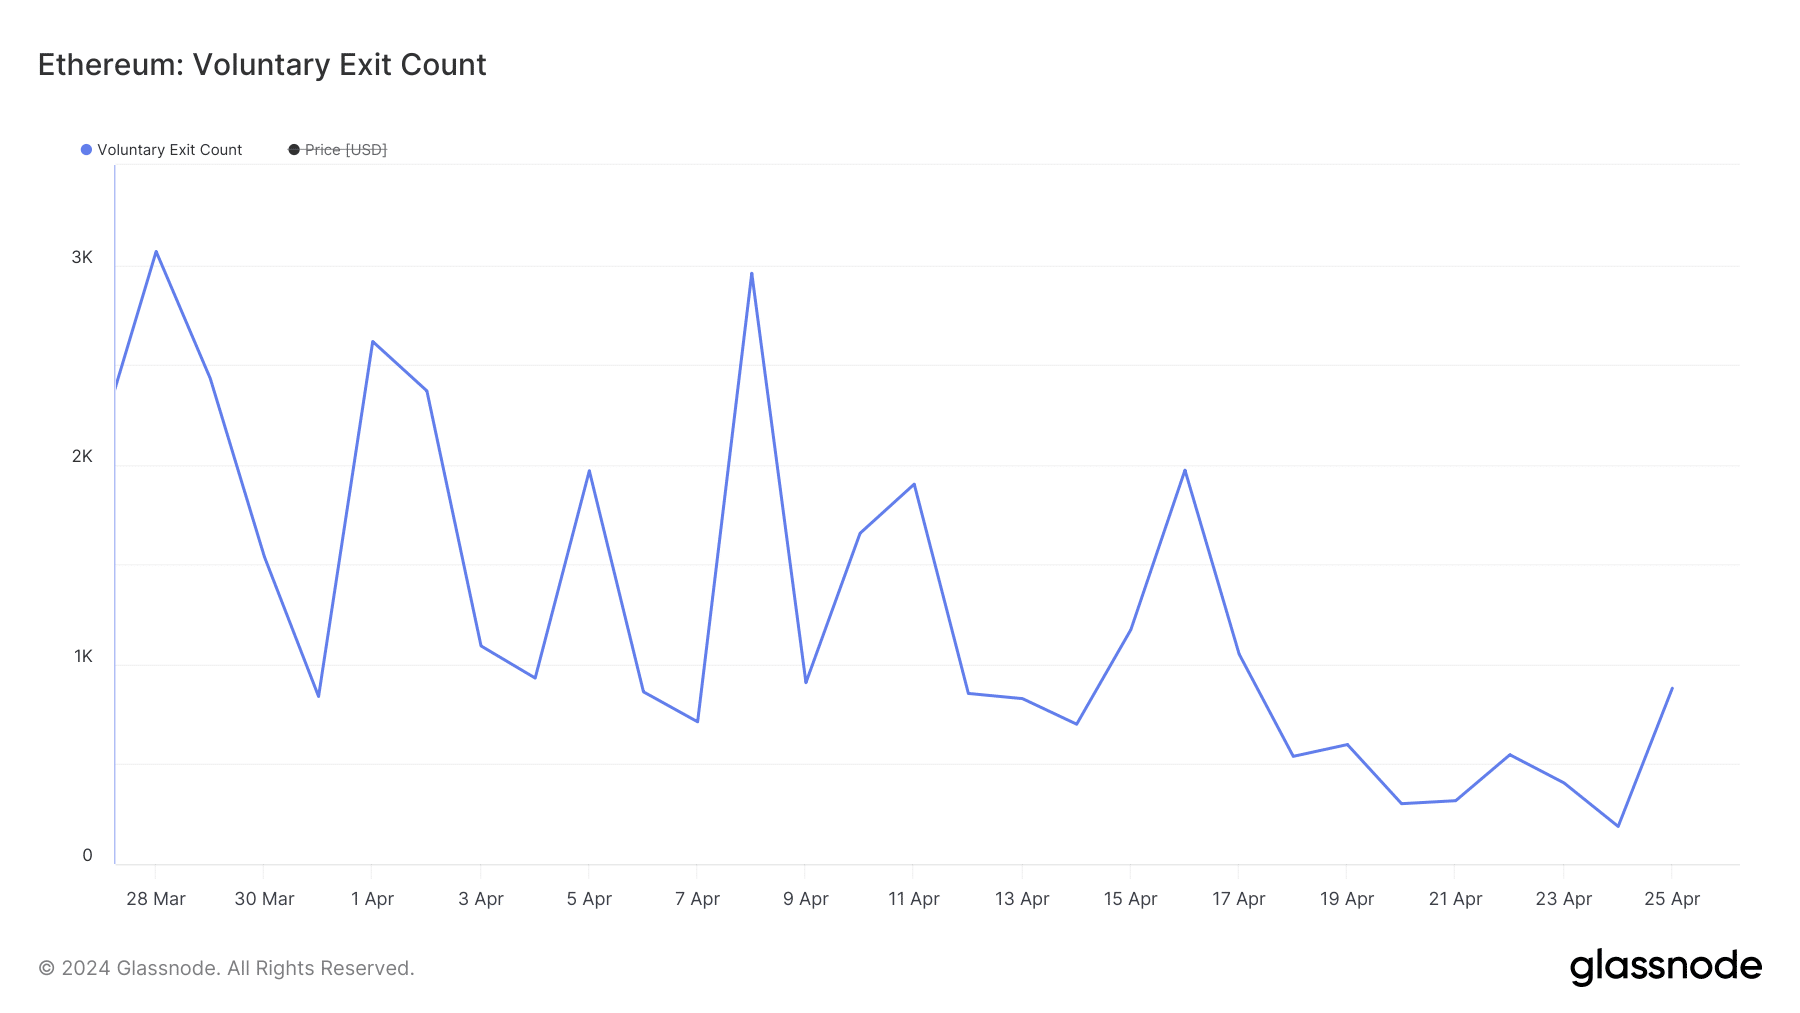
This occurred due to the recent decline in demand for the proof-of-stake (PoS) network. AMBCrypto previously reported that user activity on Ethereum has declined over the last month.
This resulted in a low ETH burn rate, which has increased the coin’s supply and made it inflationary once again.
When ETH becomes inflationary, its price experiences significant downward pressure. According to CoinMarketCap’s data, the coin’s value has dropped by 13% in the last month.
Due to ETH’s low price action, validators on the Ethereum network have not been incentivized to unstake their coins for onward sales.
The network typically witnesses a surge in validator exit when ETH price climbs, causing validators to attempt to capture gains on their previously staked coins.
With fewer validators leaving the network, the participation rate among validators has also risen to its highest in the last month.
Validators must participate in the network to ensure that Ethereum runs optimally. A high participation rate indicates reliable validator node uptime, fewer missed blocks, and superior blockspace efficiency.
As of this writing, the validators’ participation rate on the network was 99.6%.
ETH gains, but at what cost?
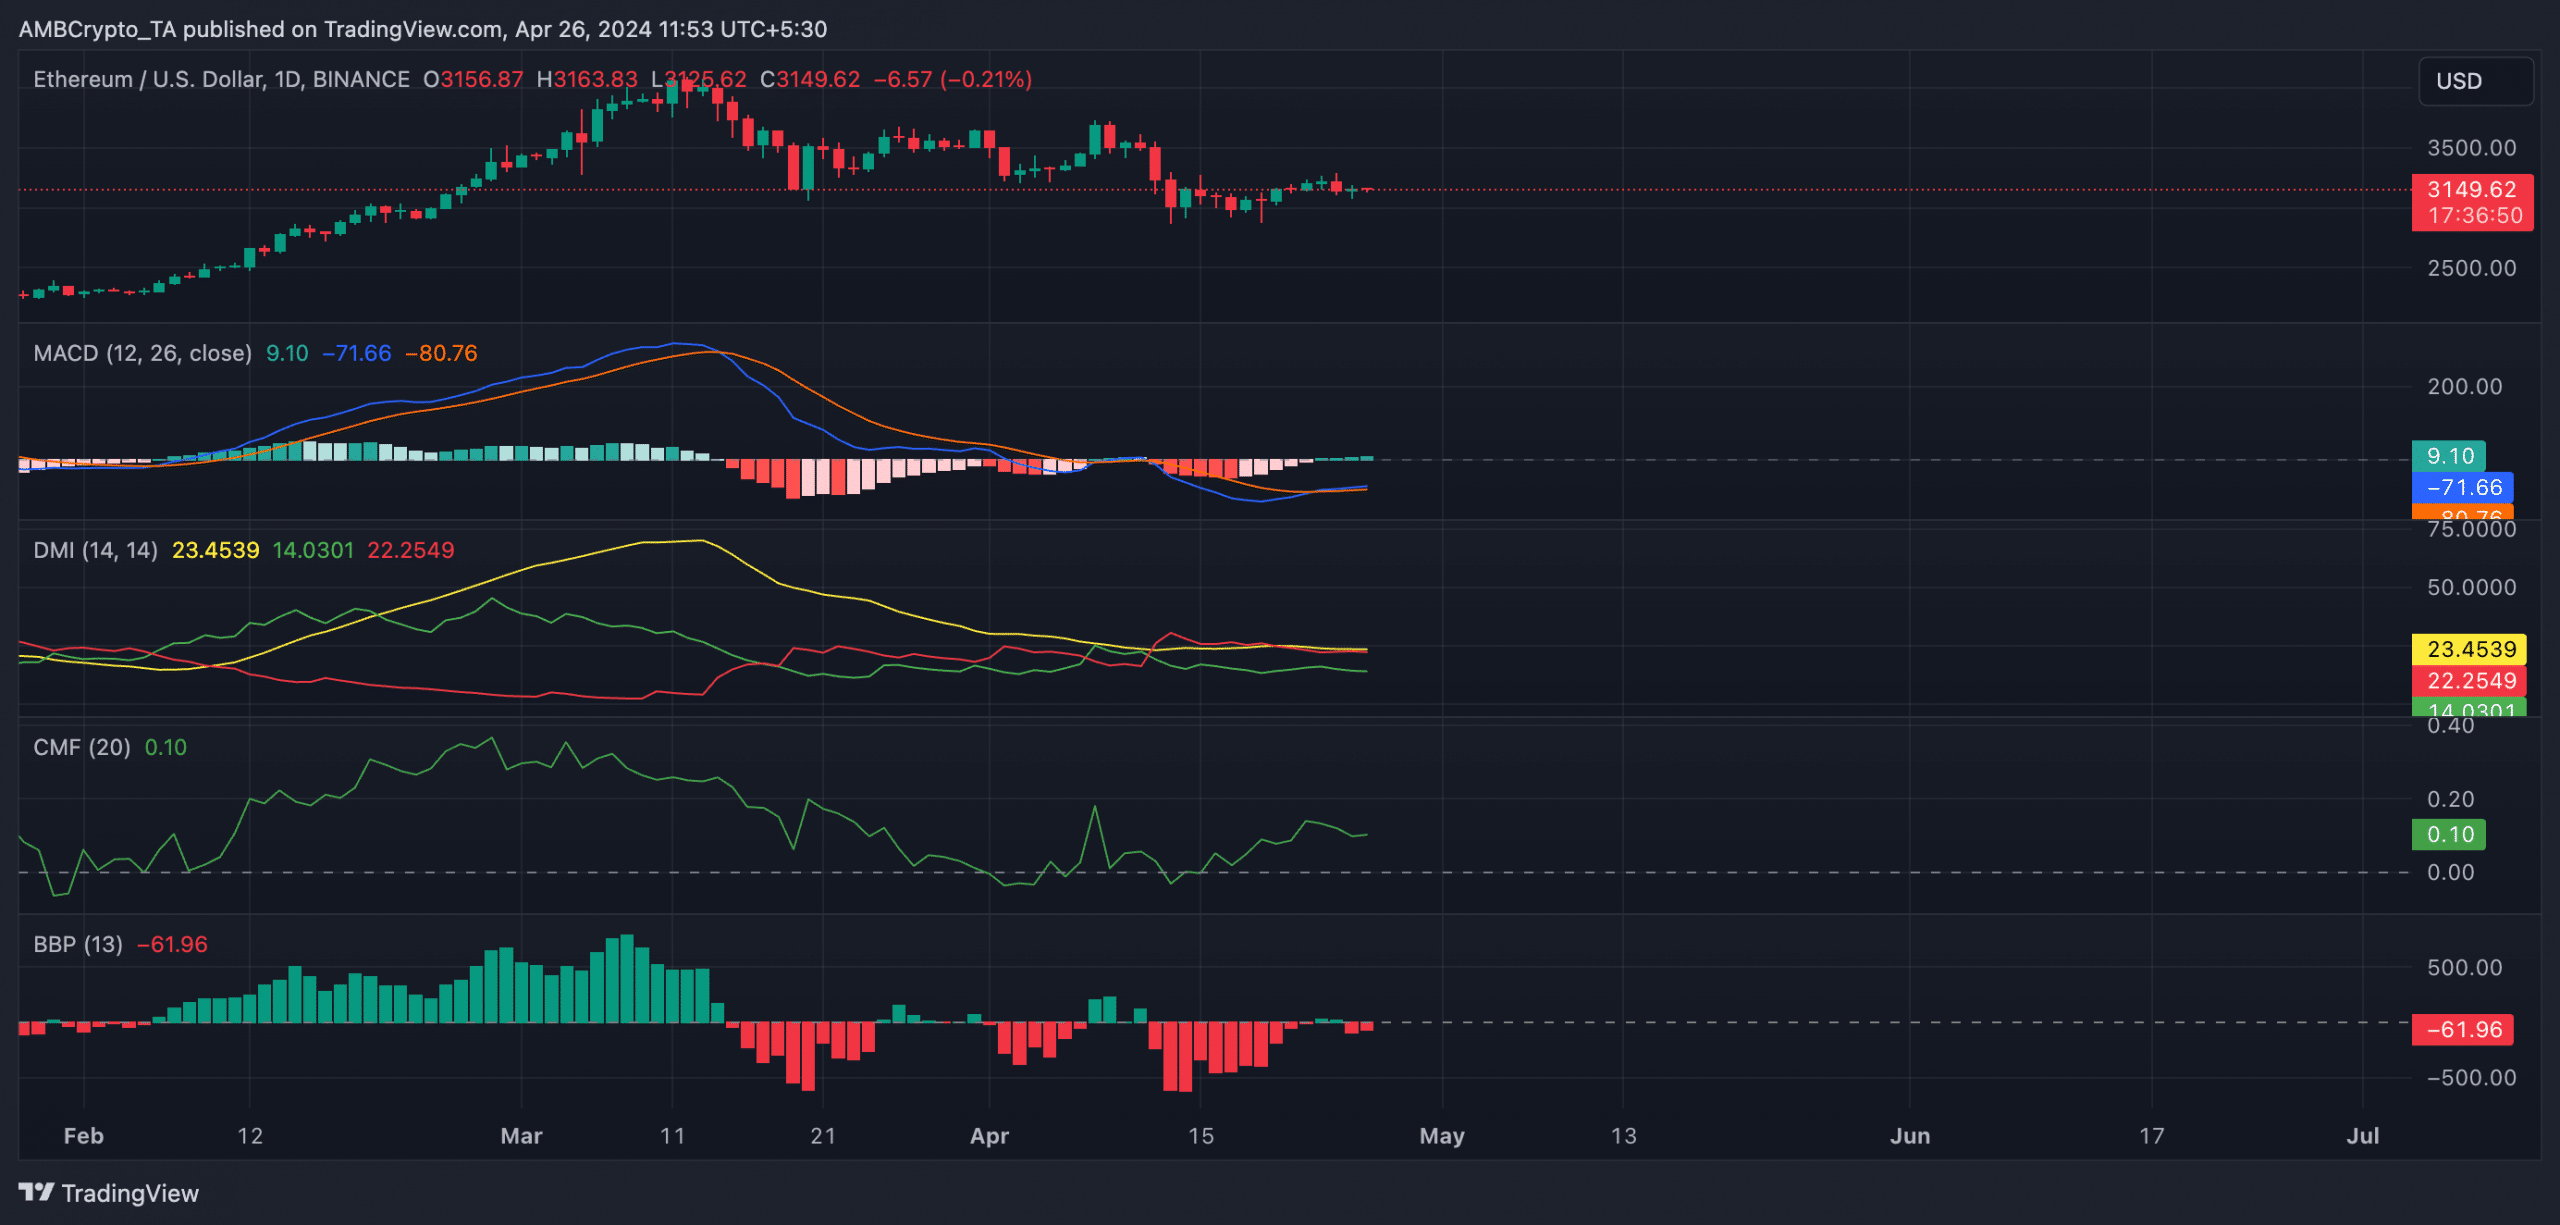
At press time, ETH traded at $3,150, recording a 5% value uptick in the last week. This price growth has been due to a minor resurgence in bullish sentiments among market participants, which AMBCrypto gleaned from its readings of the coin’s key technical indicators on a one-day chart.
For example, the coin’s MACD line rested above its signal line at press time. This signaled that ETH’s short-term moving average is above its long-term moving average. It is viewed as a bullish signal and interpreted as an indication to take long and exit short positions.
Likewise, the coin’s Chaikin Money Flow (CMF), which measures the flow of money into and out of the market, returned a positive value at press time. This showed that the ETH market had a steady liquidity supply.
However, bearish sentiments lingered in the market. The value of the coin’s Elder-Ray Index was -61.96 at the time of press. This indicator measures the relationship between the strength of buyers and sellers in the market.
Is your portfolio green? Check the Ethereum Profit Calculator
When its value is negative, bear power is dominant in the market.
Confirming the strength of ETH bears, its negative directional index (red) was positioned above its positive index. This showed that coin sellers had more presence in the market than buyers.