Ethereum – Why THIS Tether ratio could decide ETH’s next rally
ETH/USDT ratio is at support, and the market knows this level.

Ethereum could be showing early signs that the market is closing in on a major rally.
The asset has bled capital since peaking in September 2025, with its market valuation falling by $373.83 billion—a drop larger than its present valuation. Data, however, shows Ethereum’s market capitalization could hold the answer to whether the downtrend remains in play or a reversal is near.
Ethereum and Tether market caps converge for the first time
Ethereum’s market capitalization and Tether’s have hit the same level for the first time ever, both reaching roughly $186.87 billion.
While the convergence is a rare occurrence on its own, the ratio tracking these two assets against each other reveals something more important—it has reached the support of the descending channel it trades within.
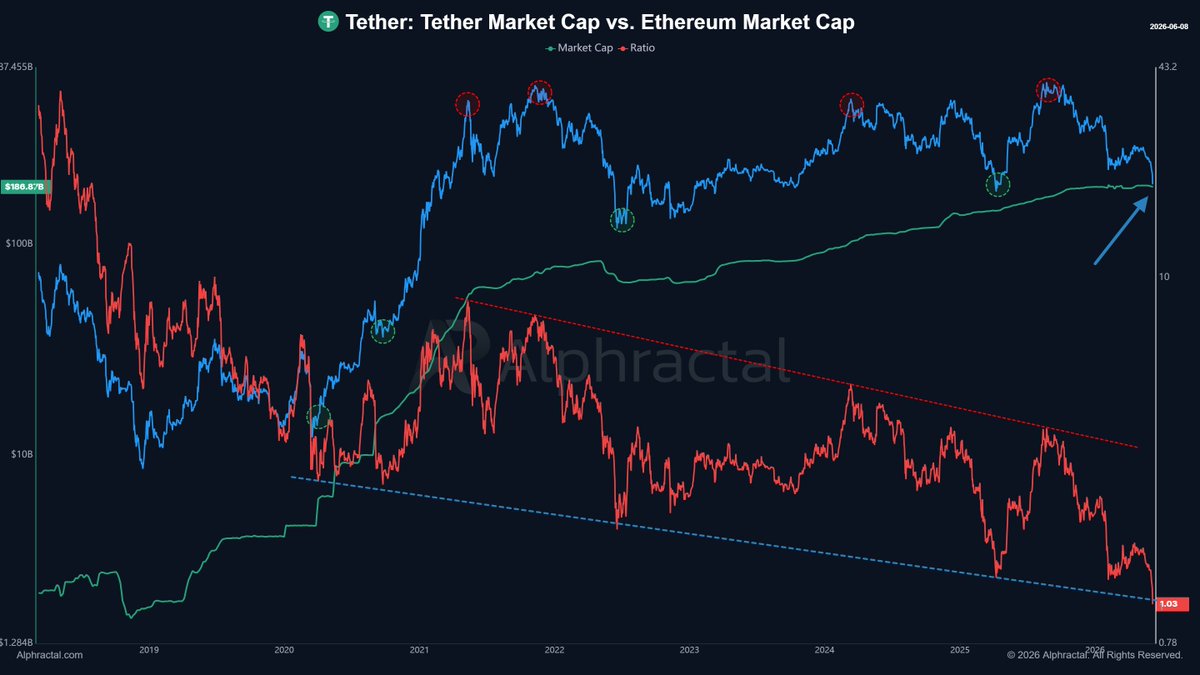
The ratio, now at 1.03, has touched that support, and trading in this zone has previously marked ETH’s bottom and led to a rally. More broadly, the indicator has correctly called Ethereum’s turning points on eight occasions—four tops and four bottoms.
If the pattern holds, Ethereum could begin a multi-week rally that recovers the capital that exited the asset over the past couple of months.
US investors are sending mixed signals on Ethereum
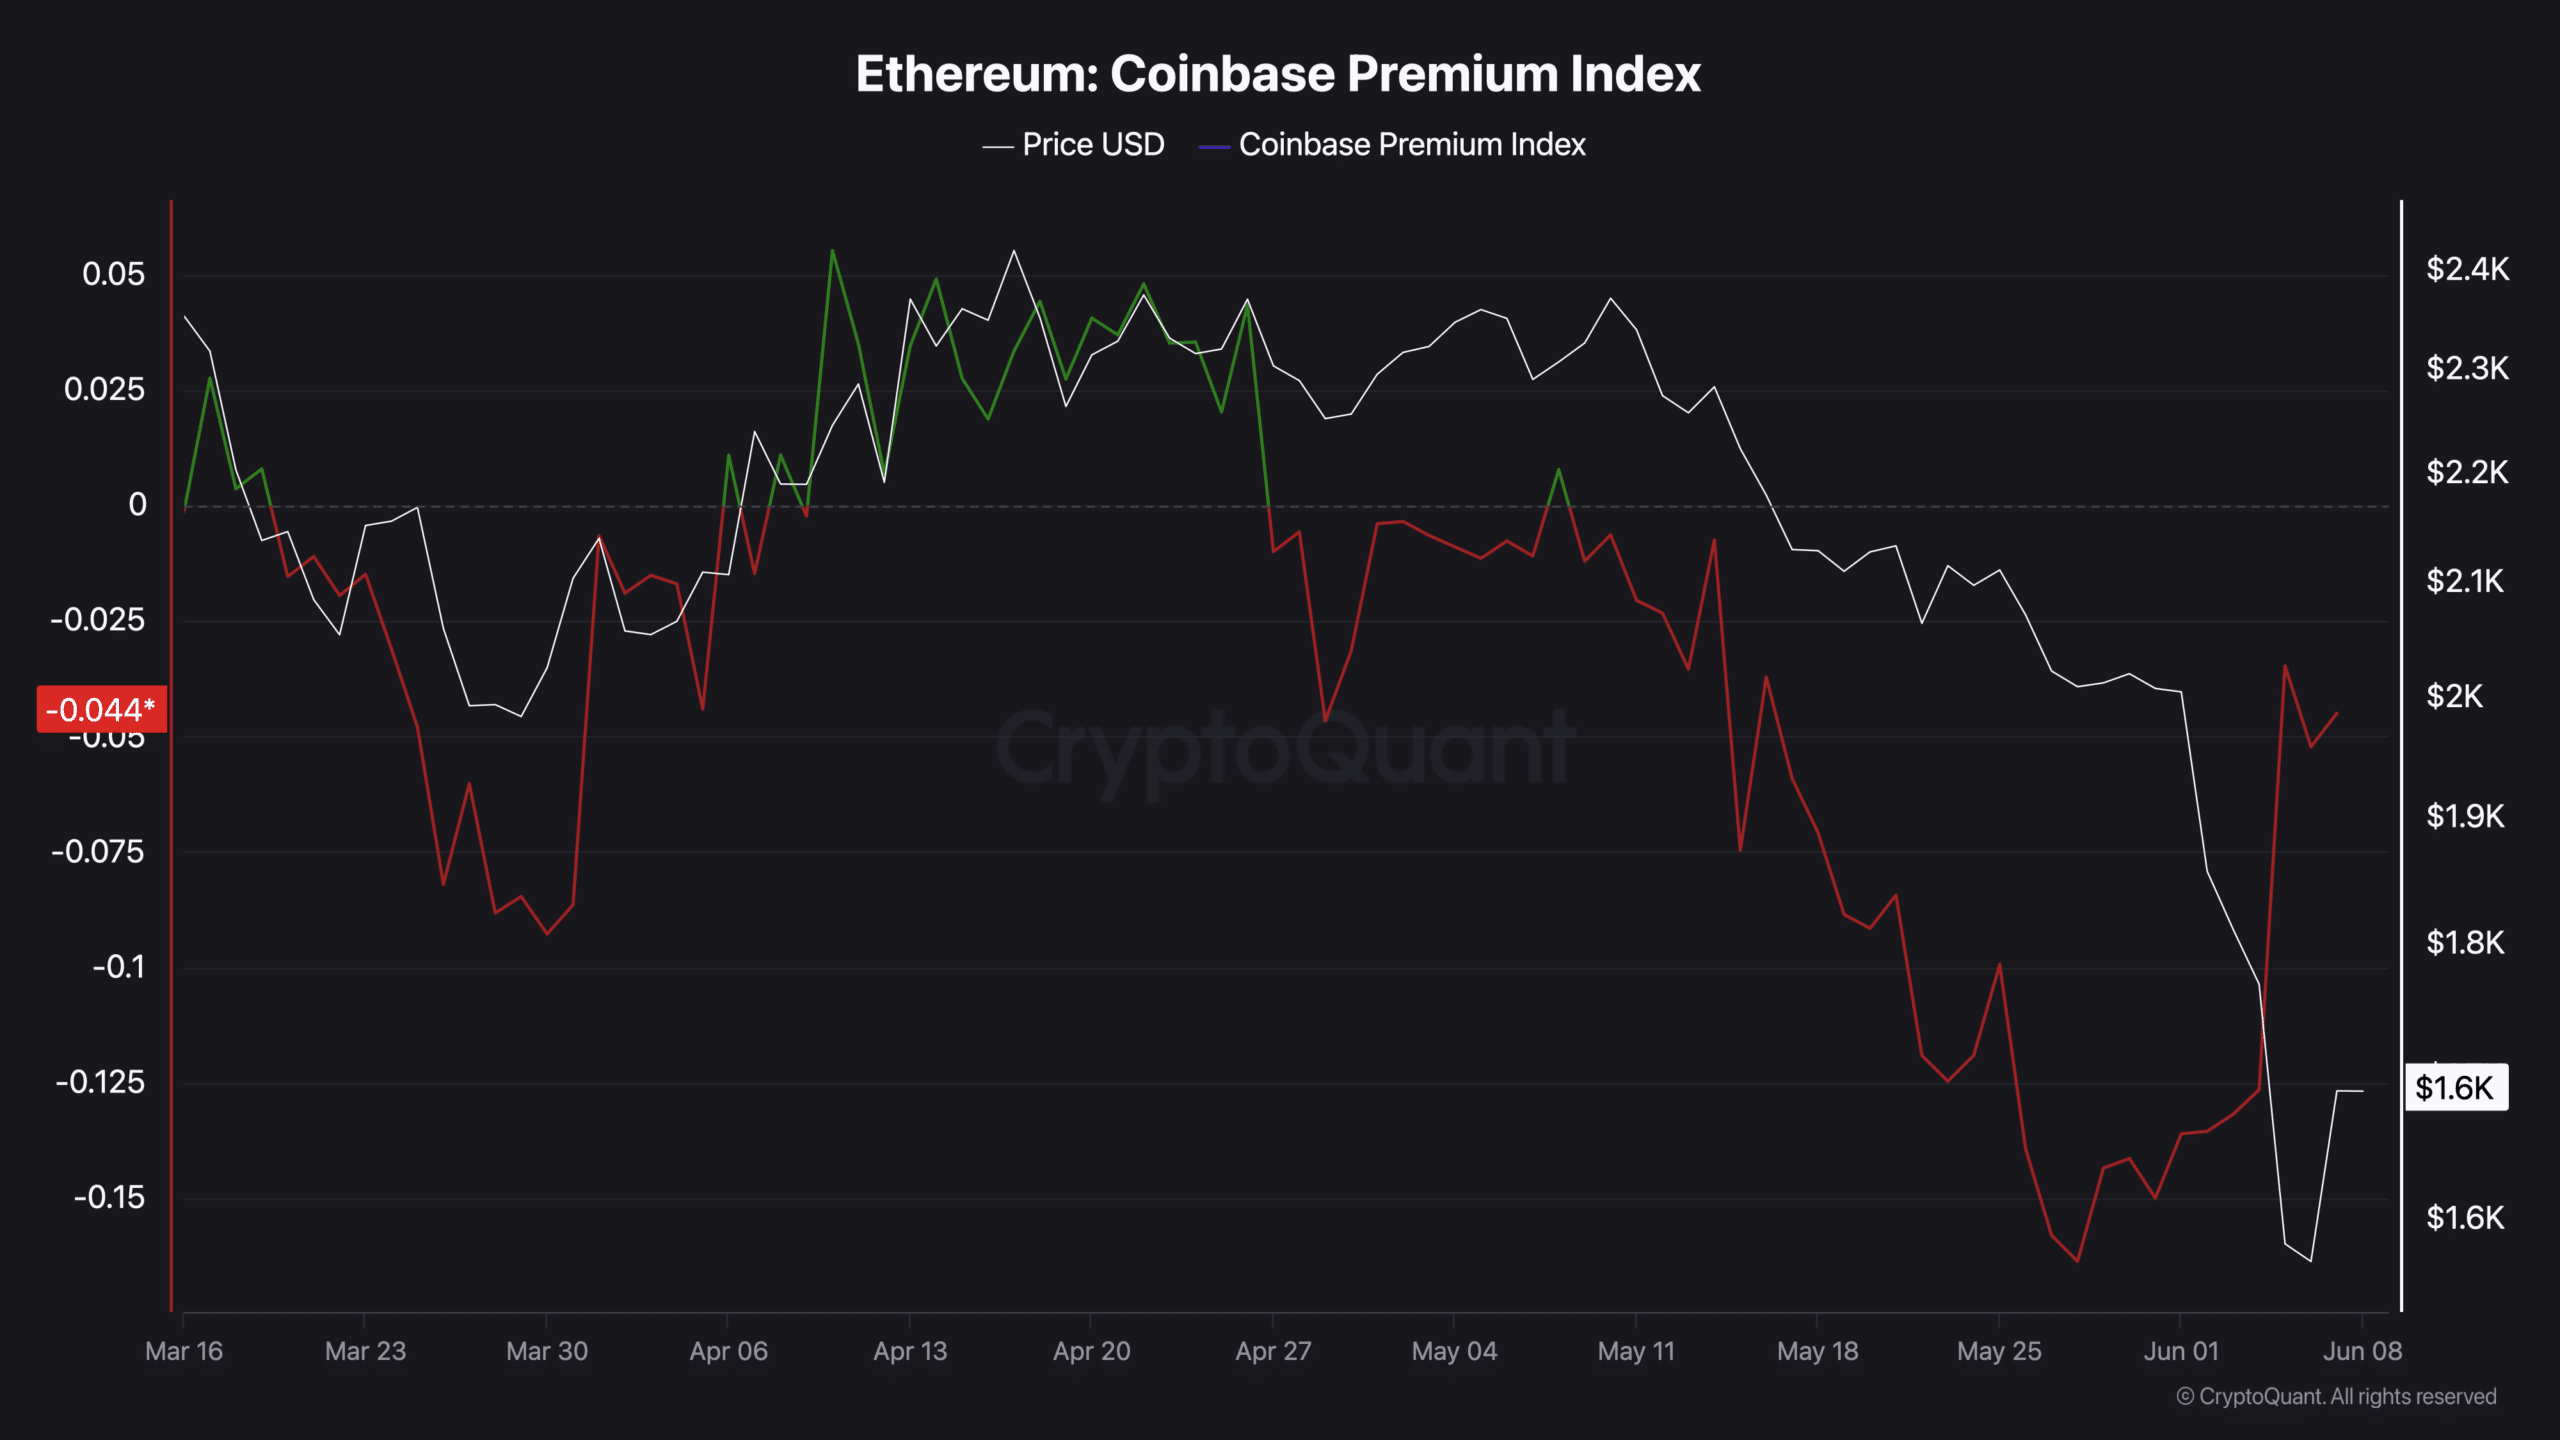
US investors are one group to watch, with analysis showing a constant bid that began on 28 May.
The Coinbase Premium Index, which measures the gap between Ethereum’s US spot price and its price on global exchange Binance, points to strong demand, rising from -0.17 to -0.04.
A rise here means US demand outpaces the global market on Binance, yet that hasn’t translated into buying across the board, as data from US spot Ethereum ETFs shows mostly sell-offs.
Between 28 May and the last trading session, the funds recorded outflows every single day except 4 June, when total netflow came in at $19.04 million.
Spot ETH ETF flows remain only a fraction of total US trading, however, pointing to a disparity that suggests traditional investors are heavily bearish while crypto-inclined investors stay firmly bullish.
Ethereum’s broader flows are turning toward sellers
Buying outweighed selling pressure across the spot market between 28 May and today, with more ETH bought than sold over the stretch.
Over the past 48 hours, though, sell pressure has built, with total netflow reaching $113.63 million and sellers now dominating.
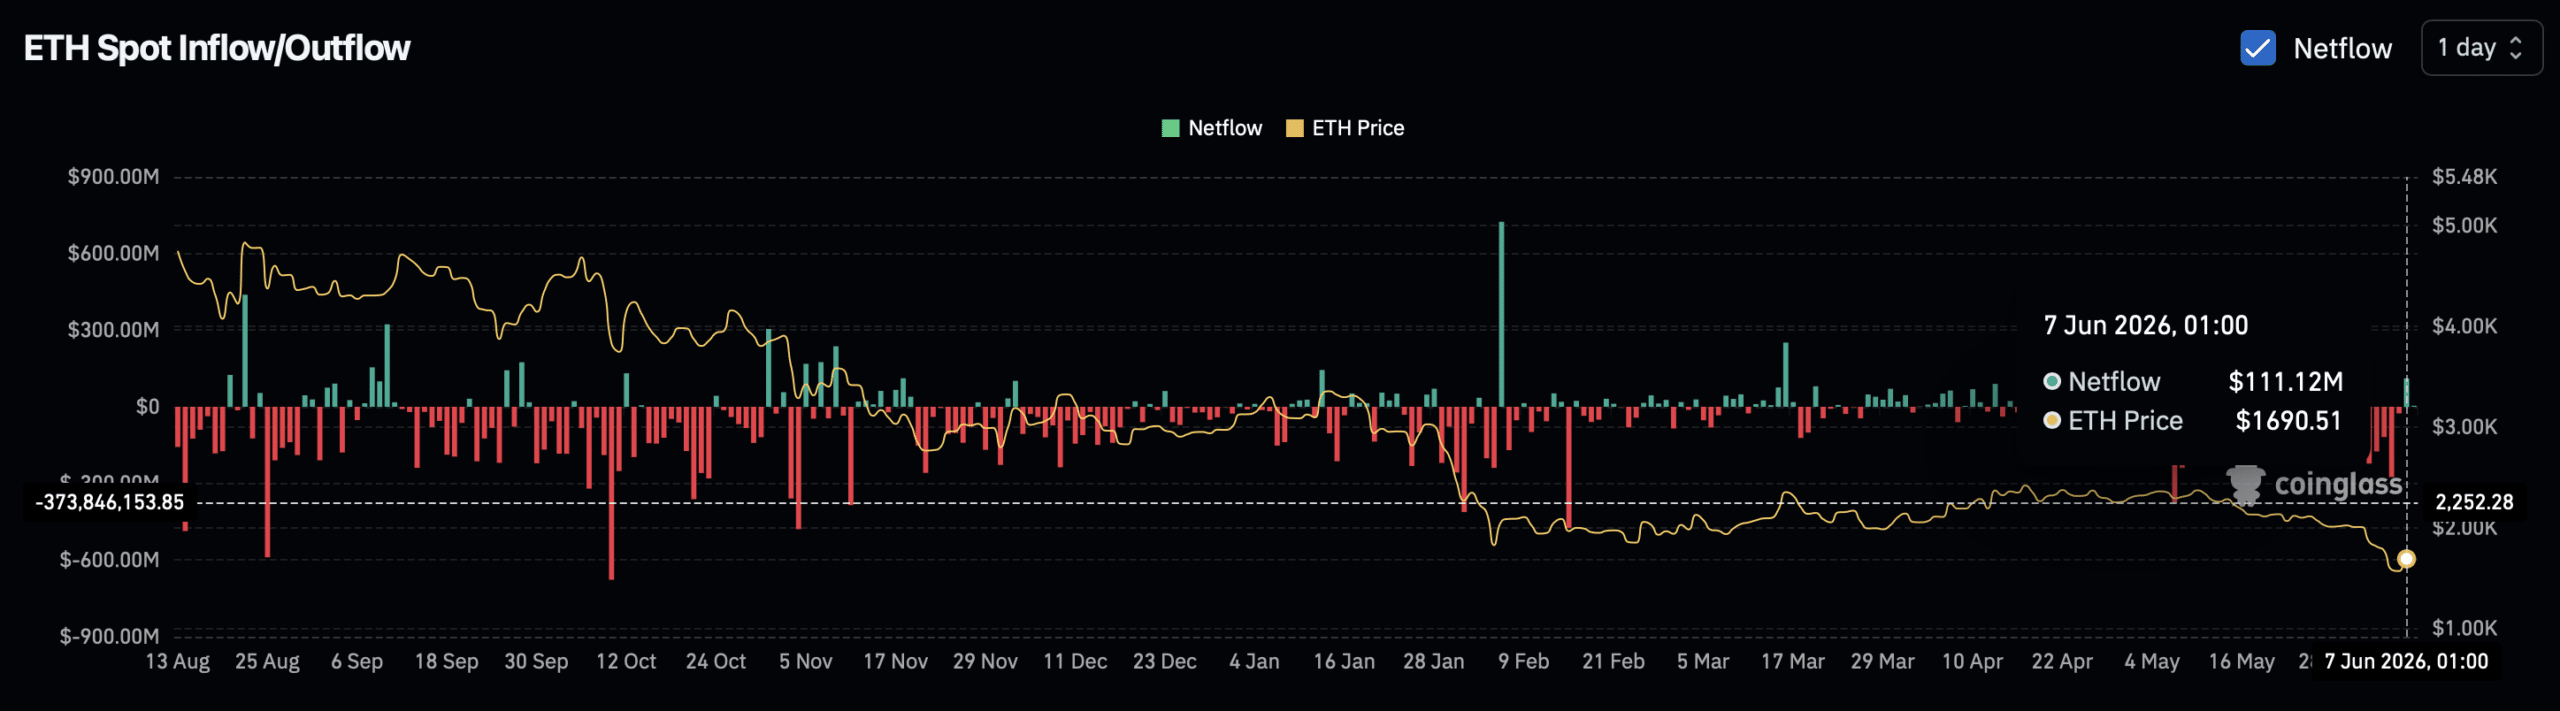
A sell-off of this scale could amount to a simple correction, which is notable because the 7 June sell netflow ran significantly higher at $111.12 million against the $2.51 million recorded at the time of writing on 8 June.
How this develops is worth watching, and what comes next for ETH will depend on activity from US investors and the broader investor base alike.
Final Summary
- A rare alignment between Ethereum and Tether’s market caps has historically marked ETH bottoms, hinting a multi-week rally could be near.
- US buyers have been stepping in since late May, but a fresh wave of selling over the past 48 hours shows the recovery still faces resistance.


