Ethereum, Zcash, ETC Price Analysis: 23 December

The altcoin market took a bit of a beating over the past few hours as many large-cap coins turned red on the charts. Bitcoin Dominance rose to show 68.68% at the time of writing, Ethereum saw a rejection at $640 in recent hours and was likely to test the $583 level of support. Zcash was headed once more to a region of demand, as was the case for Etheruem Classic.
Ethereum [ETH]
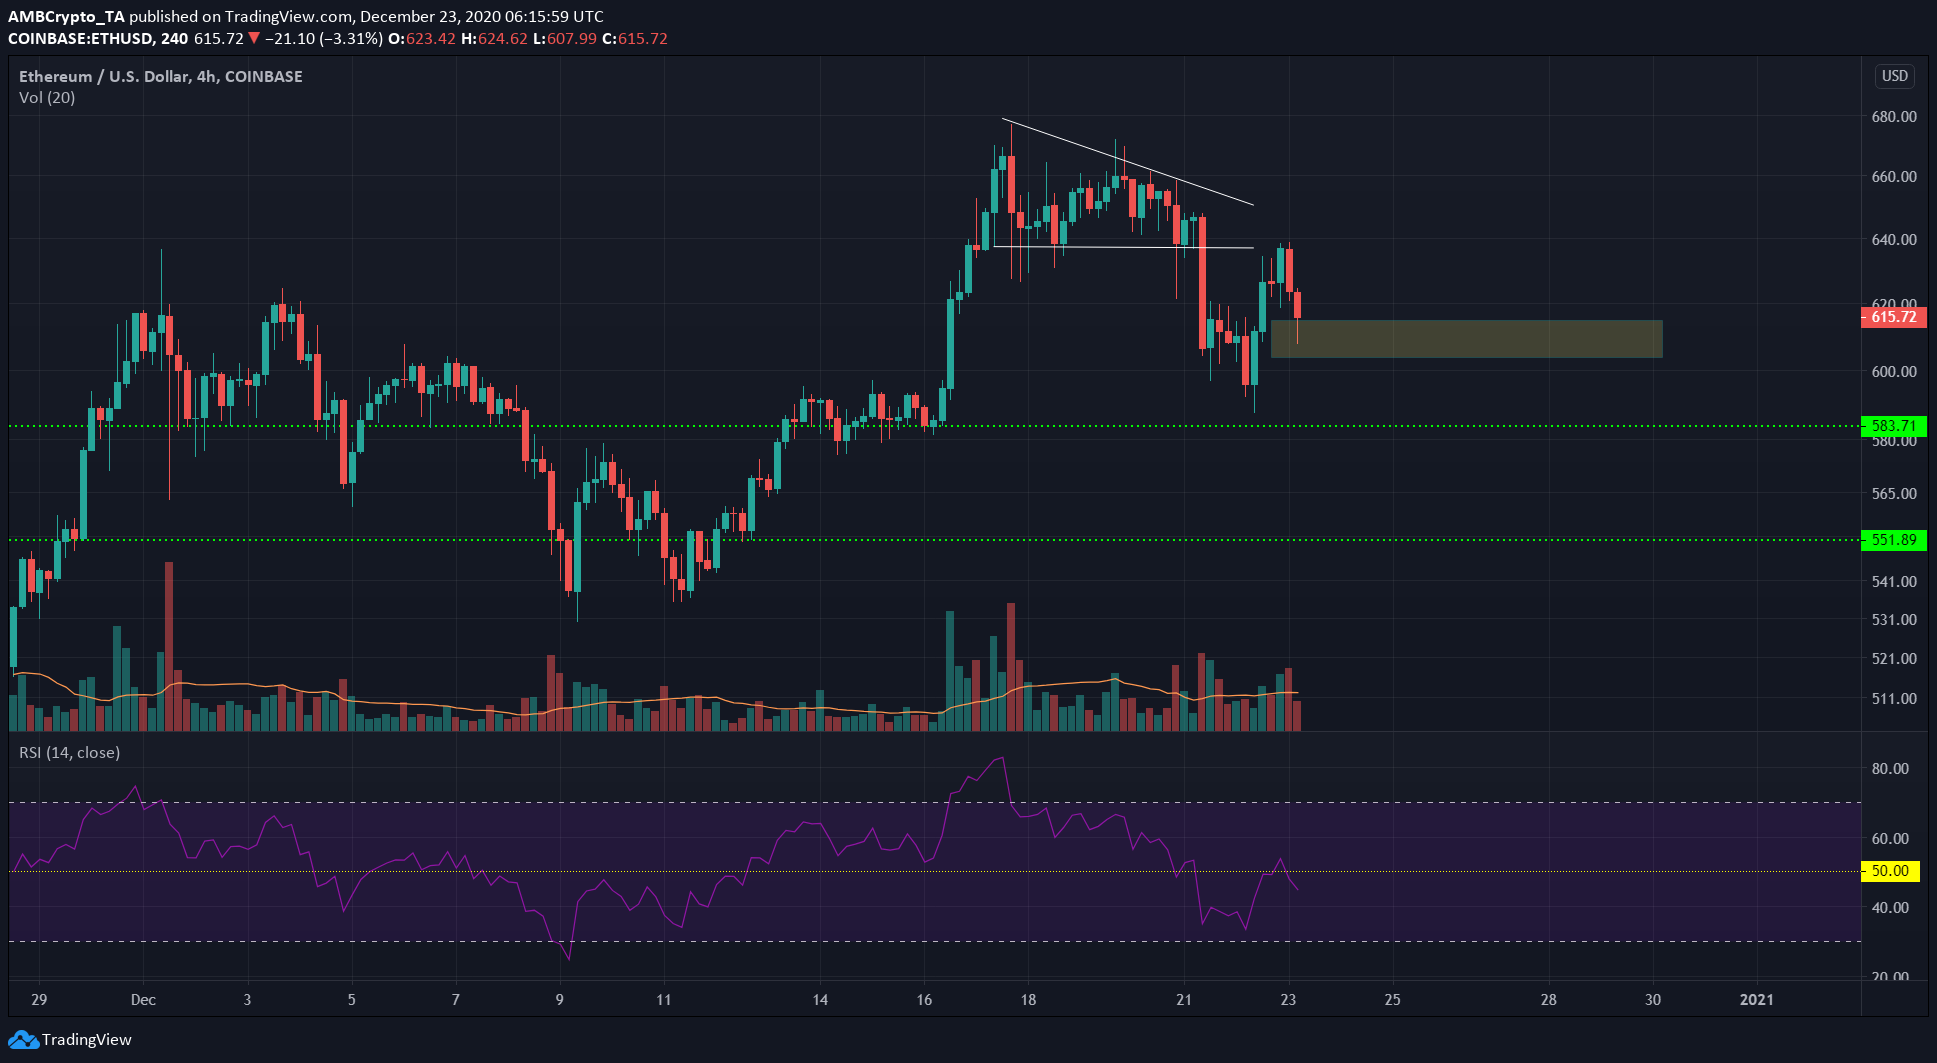
The $615 level has been a ceiling for the price of Ether, evidenced by the price action in late November. A breakout to the upside occurred a week ago when ETH surged to $677, however, the prices were quickly pushed lower to $640.
This level was defended for a few days as the price formed a descending triangle pattern, and ETH saw a wave of selling that caused a drop to $600.
A move outside the pocket of liquidity at the $600 to $615 region could decide the next direction of ETH. The RSI sank below the neutral 50 and retested the same line as resistance to indicate a downtrend in play.
Combined with the rejection at the $640 level a few hours ago, it appeared that ETH would see a move to $583 in the coming days.
Zcash [ZEC]
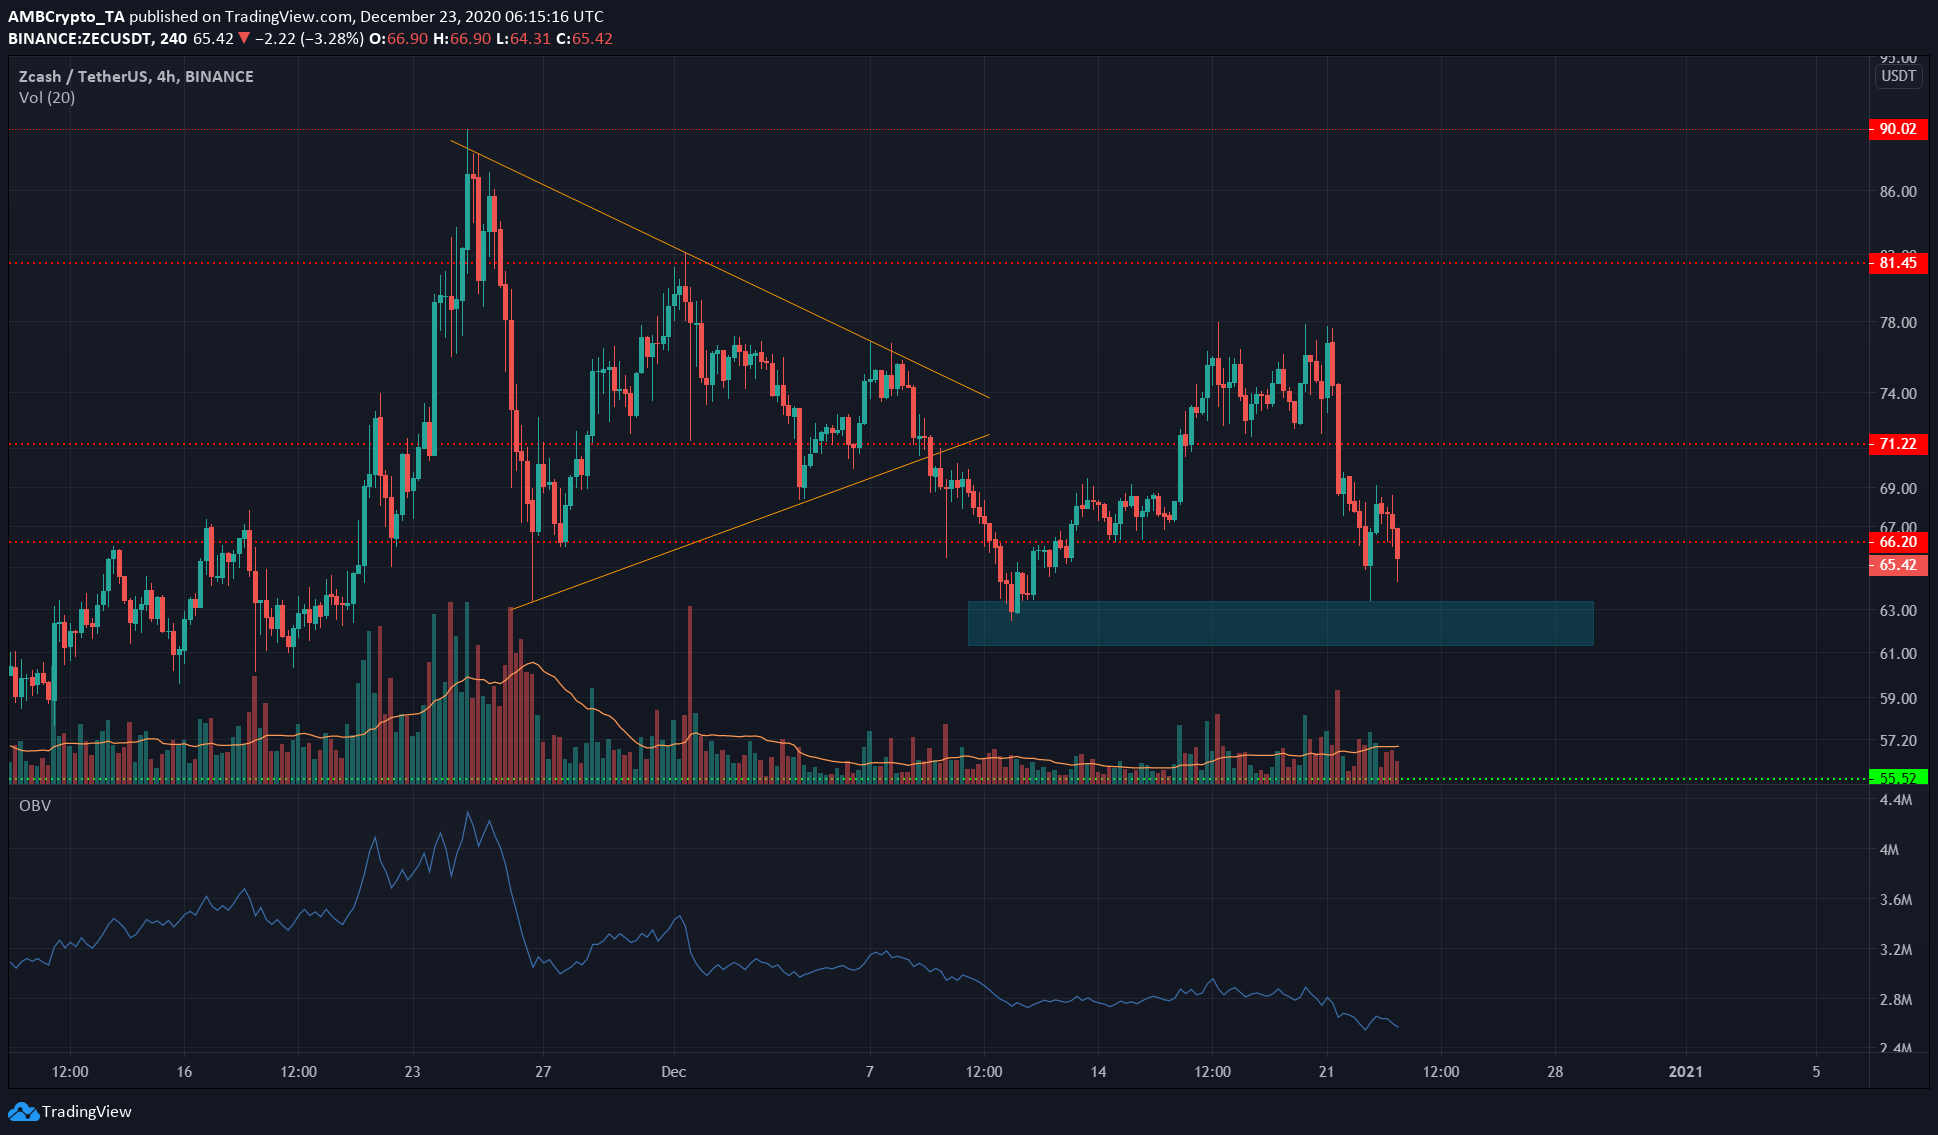
ZEC broke out to the downside of a symmetrical triangle two weeks ago and bounced off the region of demand at the $62 mark. It climbed as high as $75 but there was no buy-side conviction behind the rally.
The OBV highlighted the steady selling volume of recent weeks. Bulls were unable to gain any traction in the markets, and sellers succeeded in forcing the price back beneath the $72 and $66 levels.
ZEC was headed back toward the $62 region.
Ethereum Classic [ETC]
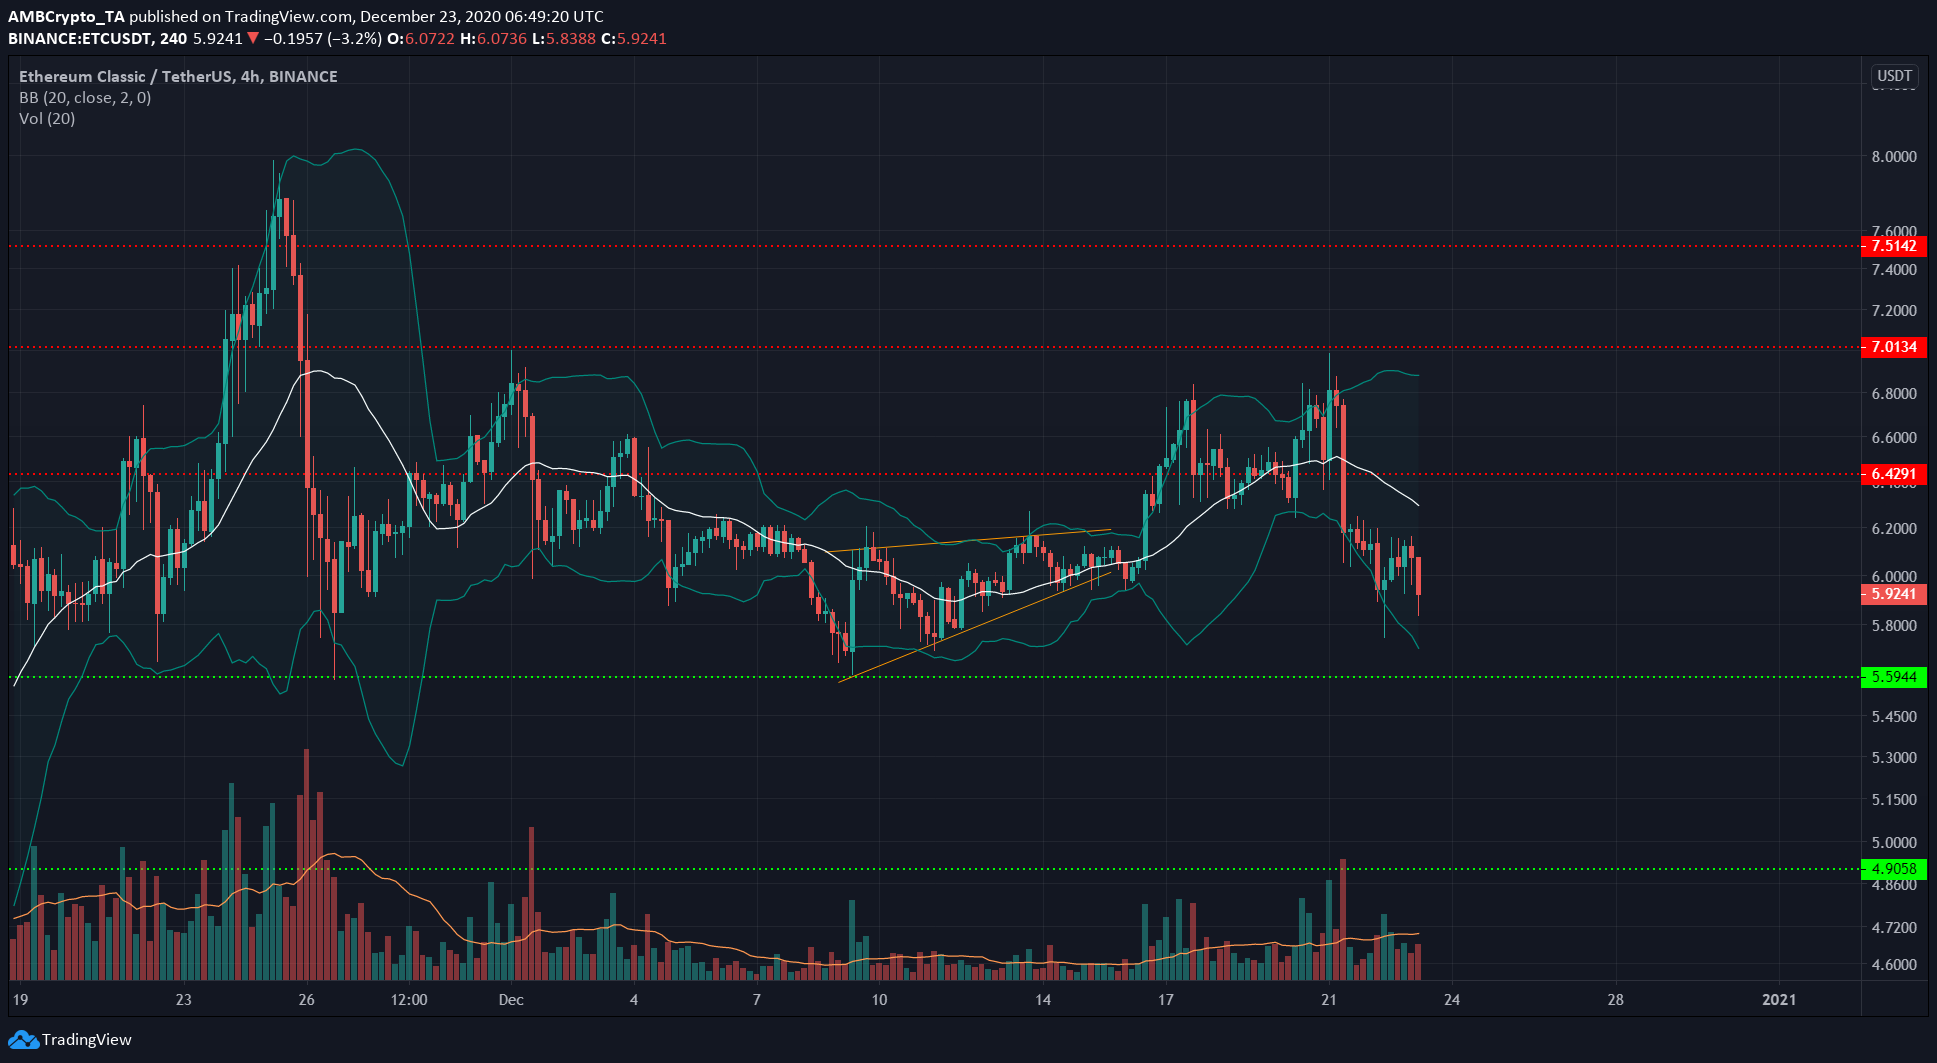
Last week, ETC climbed above the $6.42 level and defended it as support for a few days, but more recently the volatility spiked. There was notable trading volume behind the moves as well to signify strength behind the drop.
The Bollinger bands appeared to, briefly, tighten around the price but on the 20th, ETC dipped beneath $6.42 and subsequently rose to $6.98, followed by a plummet to $6.16, all in the span of 40 hours.
The price was moving toward the lower band at the time of writing and had the $5.6 price point as its next level of support.