Ethereum’s breakout to $2,500 depends on these factors

Disclaimer: The findings of the following analysis are the sole opinions of the writer and should not be taken as investment advice
Weekly gains for Ethereum amounted to over 25% as the world’s largest altcoin managed to bounce back from its 26 June low of $1,717. With recovery ongoing in the broader market and ETH’s EIP-1559 upgrade soon approaching, bullish sentiment is expected to be high over the coming days.
In fact, the price seemed to be tilting towards another breakout post the formation of a bull flag. At the time of writing, Ethereum was trading at $2,220, up by 9% over the last 24 hours.
Ethereum 12-hour chart
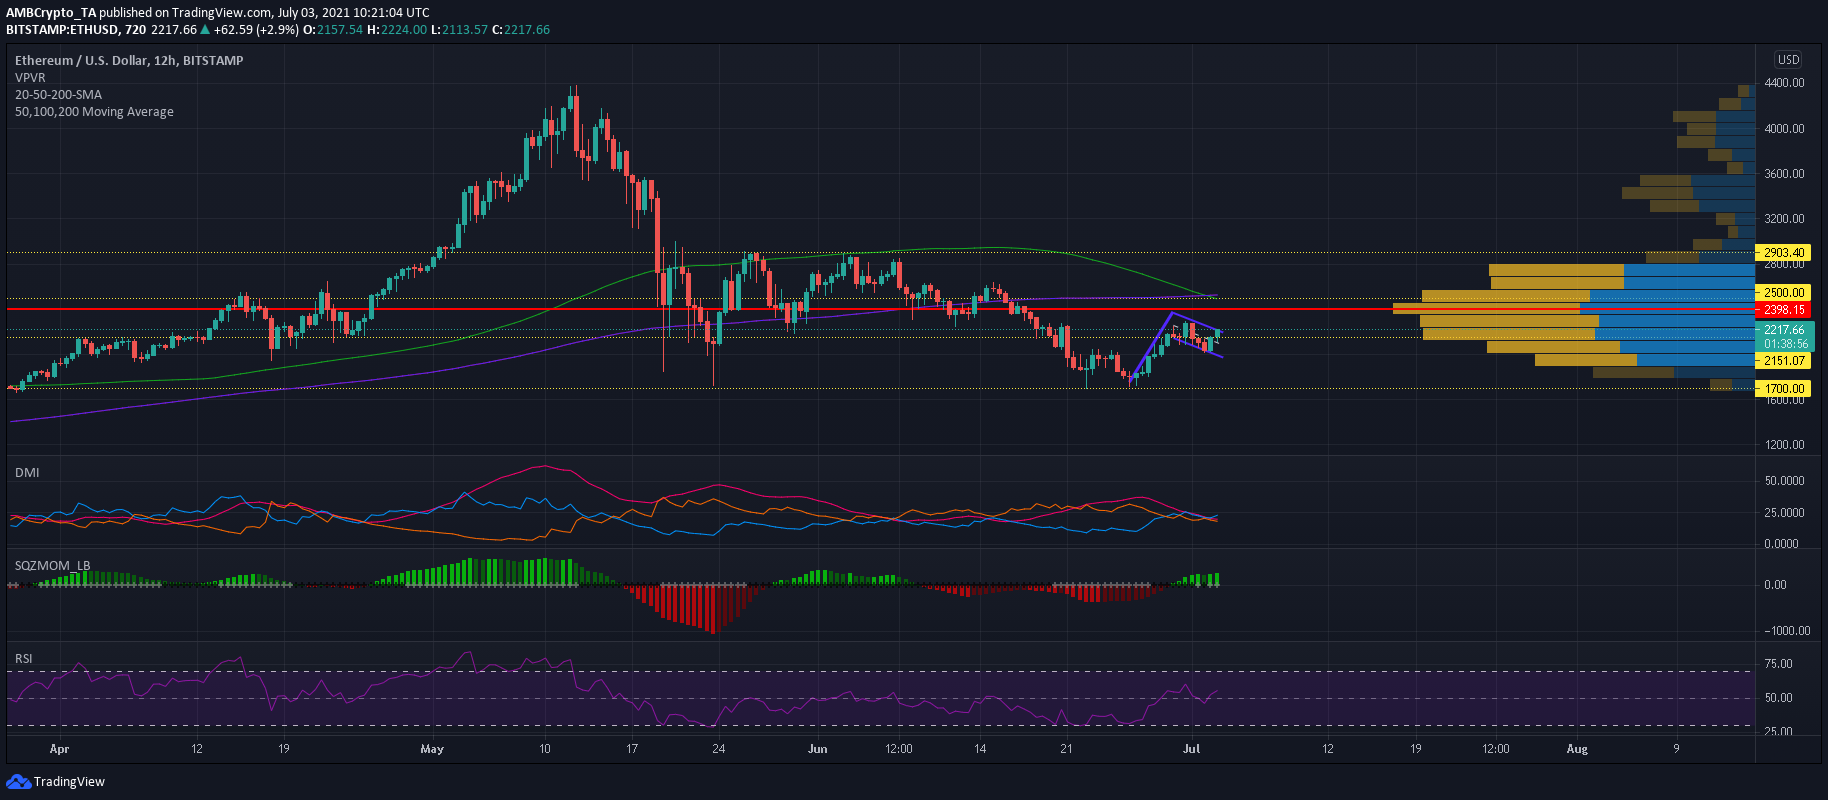
Ethereum’s market has been highly volatile since mid-June. The inability to climb above $2,600 on 15 June led to a downtrend, one which dragged ETH to a swing low of $1,717. However, a 33% rally soon followed as ETH reclaimed lost ground.
Its movement over the past 7 days led to the formation of a bull flag and its jump from $1,700 to $2,300 formed the flag pole. If the price manages to climb above the upper trendline, another 13% hike is possible towards the 12-hour 200-SMA (green) and $2,500-mark. Interestingly, the Visible Range’s point of control lay slightly below this point at $2,400.
Reasoning
The Directional Movement Index underlined a shift in market dynamics towards the bulls. The +DI crossed above the -DI for the second time since 15 May as buying pressure returned to the market. However, an ADX reading of 20 pointed to some sideways movement before the breakout took place.
The Squeeze Momentum Indicator noted a series of rising green bars as bullish momentum was on the up. The Relative Strength Index managed to climb above 50 and entered bullish territory. These were positive signs for ETH moving forward and if buyers fully capitalize on this opportunity, the price could touch $2,500 on the back of a bull flag breakout.
A resistance zone lay between $2,400-2500 and gains could be capped at this ceiling before the next upswing. However, there are still uncertainties in the broader market and traders are advised to take caution and wait for stronger signals before initiating trades.
Conclusion
ETH’s bull flag presented chances of another 13% hike in the following days. Traders can open long positions once the price rises and sustains itself above its upper trendline and the $2,230-price level. However, they must be cautious of the next wave of selling pressure.