
- Ethereum’s price dropped by more than 7% in the last seven days.
- Most metrics and market indicators hinted at a trend reversal.
The end of May for Ethereum [ETH] was bullish as the token’s daily chart showed a massive green candlestick. But last week wasn’t in investors’ interest as the token dropped substantially.
However, the declining price trend might change soon, which might allow ETH to retest its March highs.
Ethereum enters a bullish pattern
CoinMarketCap’s data revealed that Ethereum’s price dropped by more than 7% in the last seven days. At the time of writing, ETH was trading at $3,516.89 with a market capitalization of over $422 billion.
Investors’ shouldn’t get disheartened as a bullish pattern emerged on the token’s daily chart. AMBCrypto found that ETH’s price has been consolidating inside a bullish flag pattern.
The token entered the pattern after reaching its May high. At press time, the token’s price was testing the support near the lower limit of the bullish flag pattern.
A successful test could initiate a bull rally. If that happens, then it would be surprising to see Ethereum retest its March highs of $4k in the coming weeks.
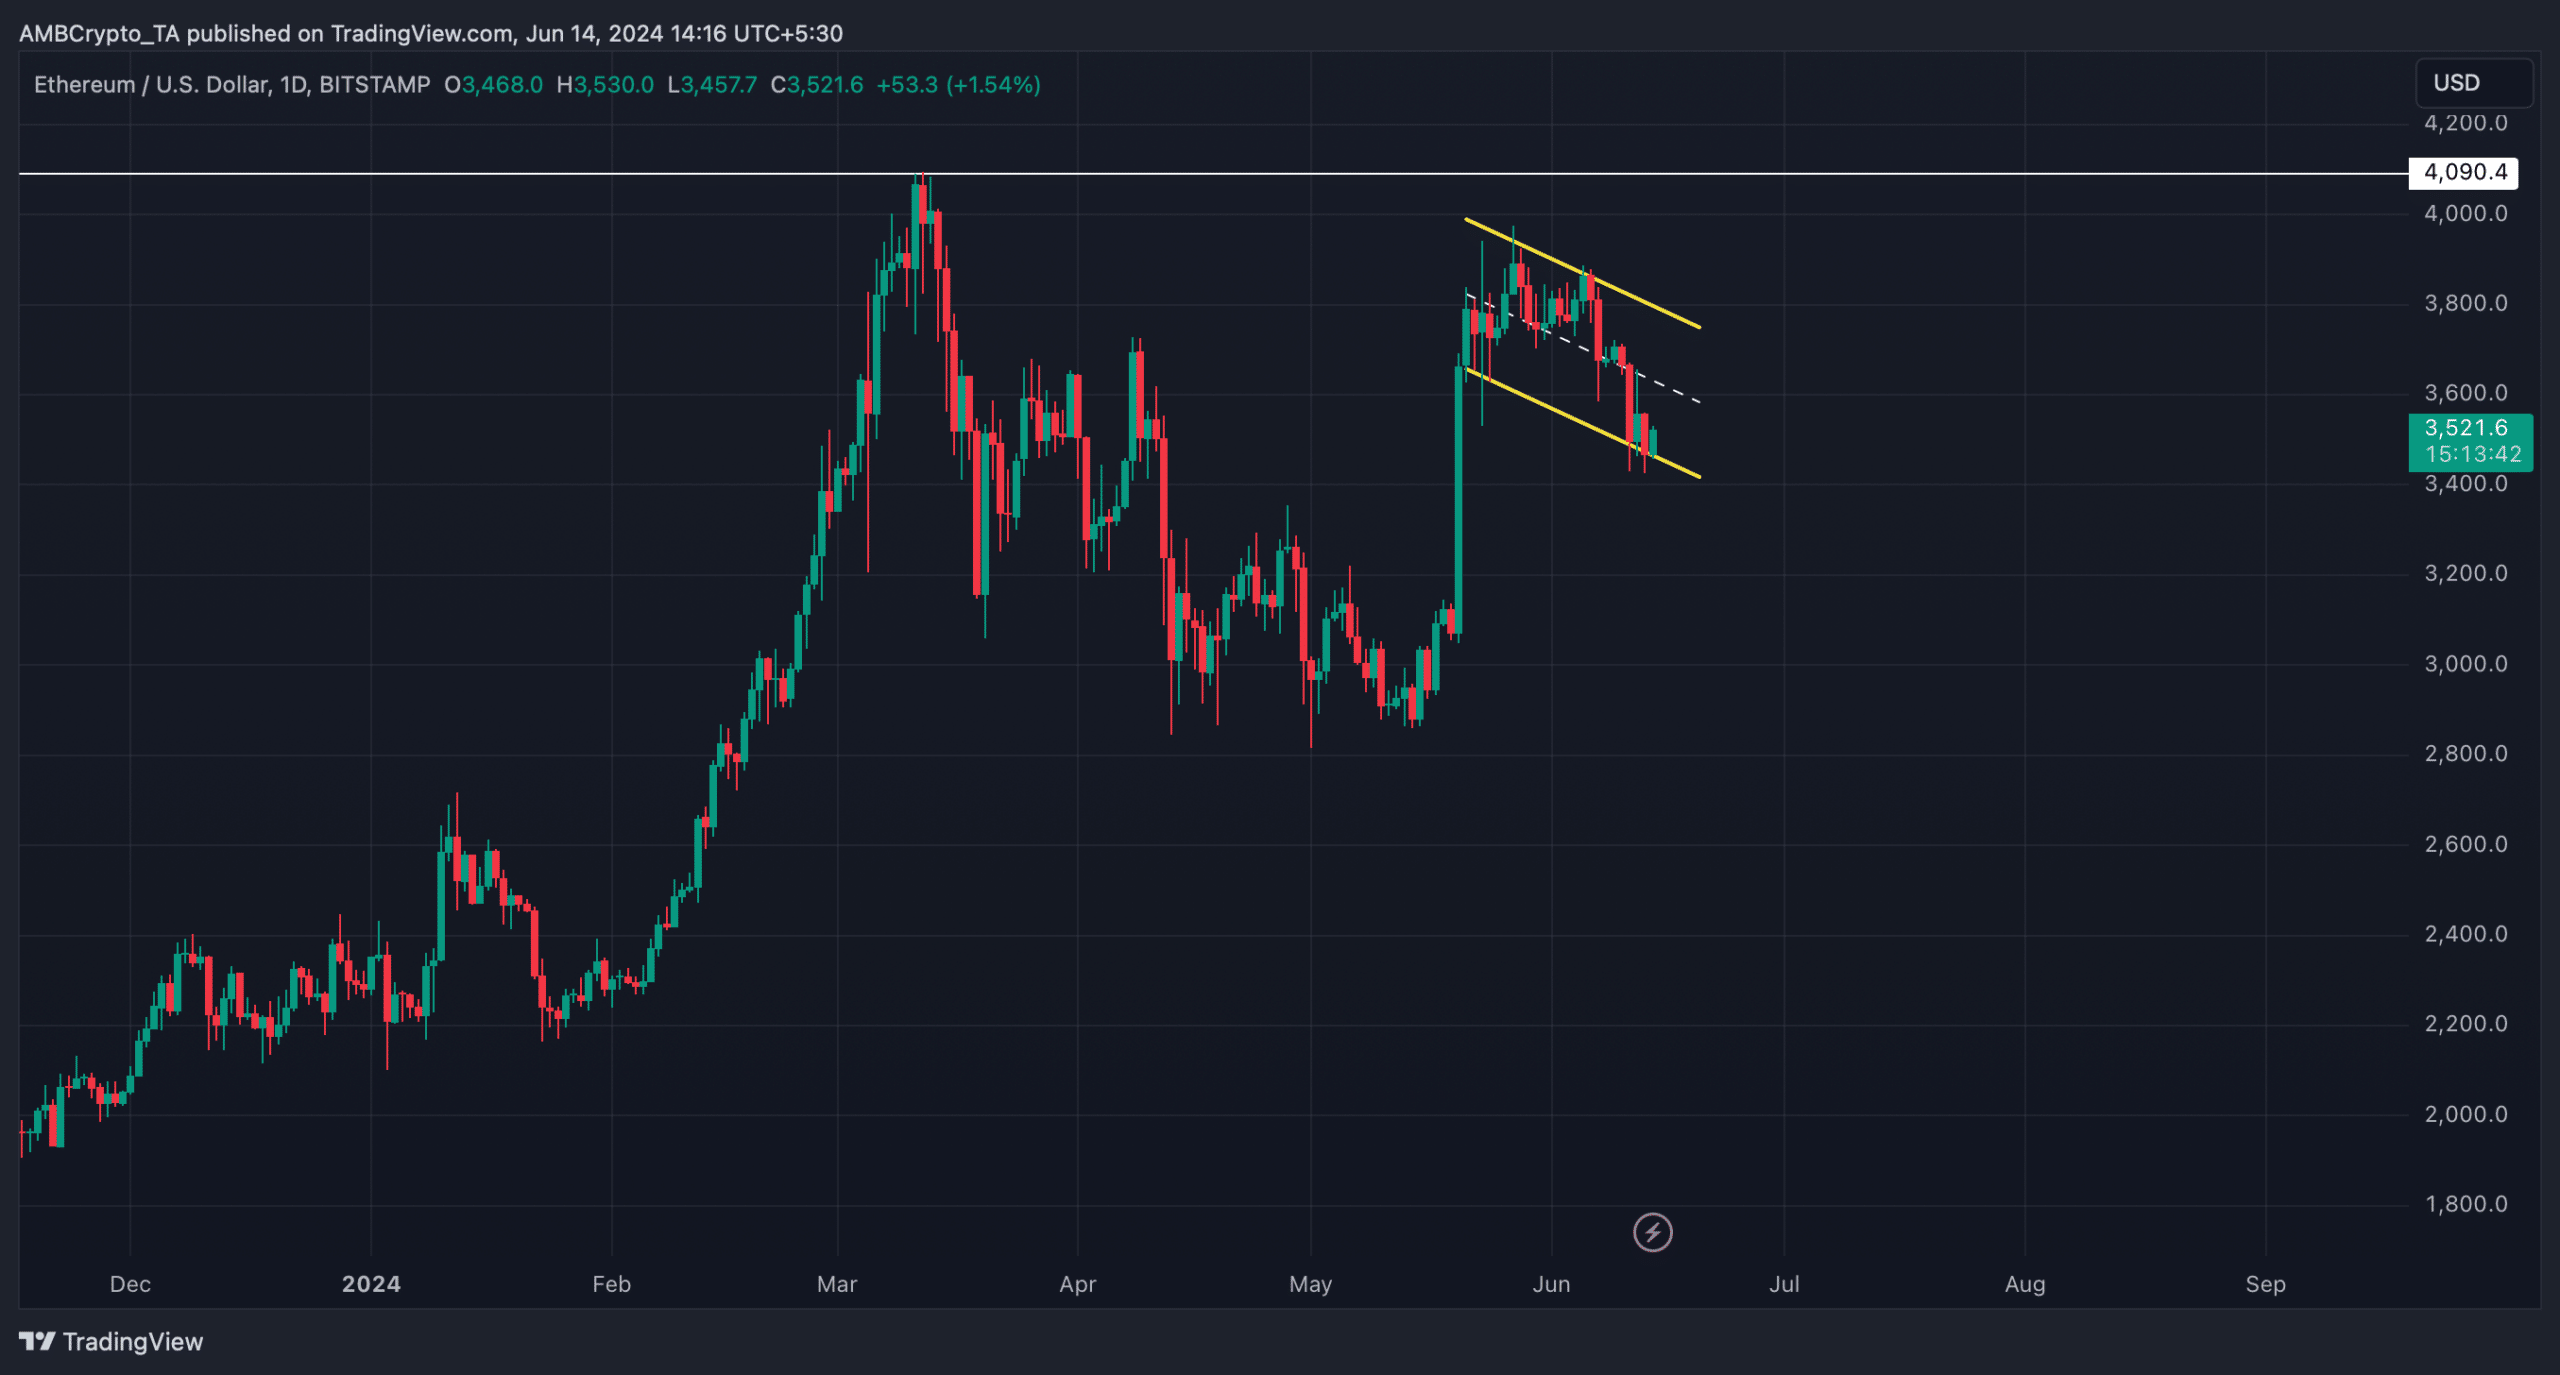
Source: TradingView
Will ETH test the pattern?
It will be crucial for ETH to register a few green candlesticks in the coming days in order for ETH to test the bullish flag pattern. To see whether that’s possible, AMBCrypto analyzed CryptoQuant’s data.
As per our analysis, ETH’s exchange reserve was dropping, meaning that buying pressure on the token was high. Additionally, the total number of coins transferred has increased by 13.93% over the last 24 hours, which can be inferred as a bullish signal.
Things in the derivatives market also looked optimistic as ETH’s funding rate rose. This meant that long-position traders are dominant and are willing to pay short-position traders.
AMBCrypto’s look at Glassnode’s data pointed out that ETH’s NVT ratio dropped last week. Whenever the metric drops, it means that an asset is undervalued, which usually results in price upticks.
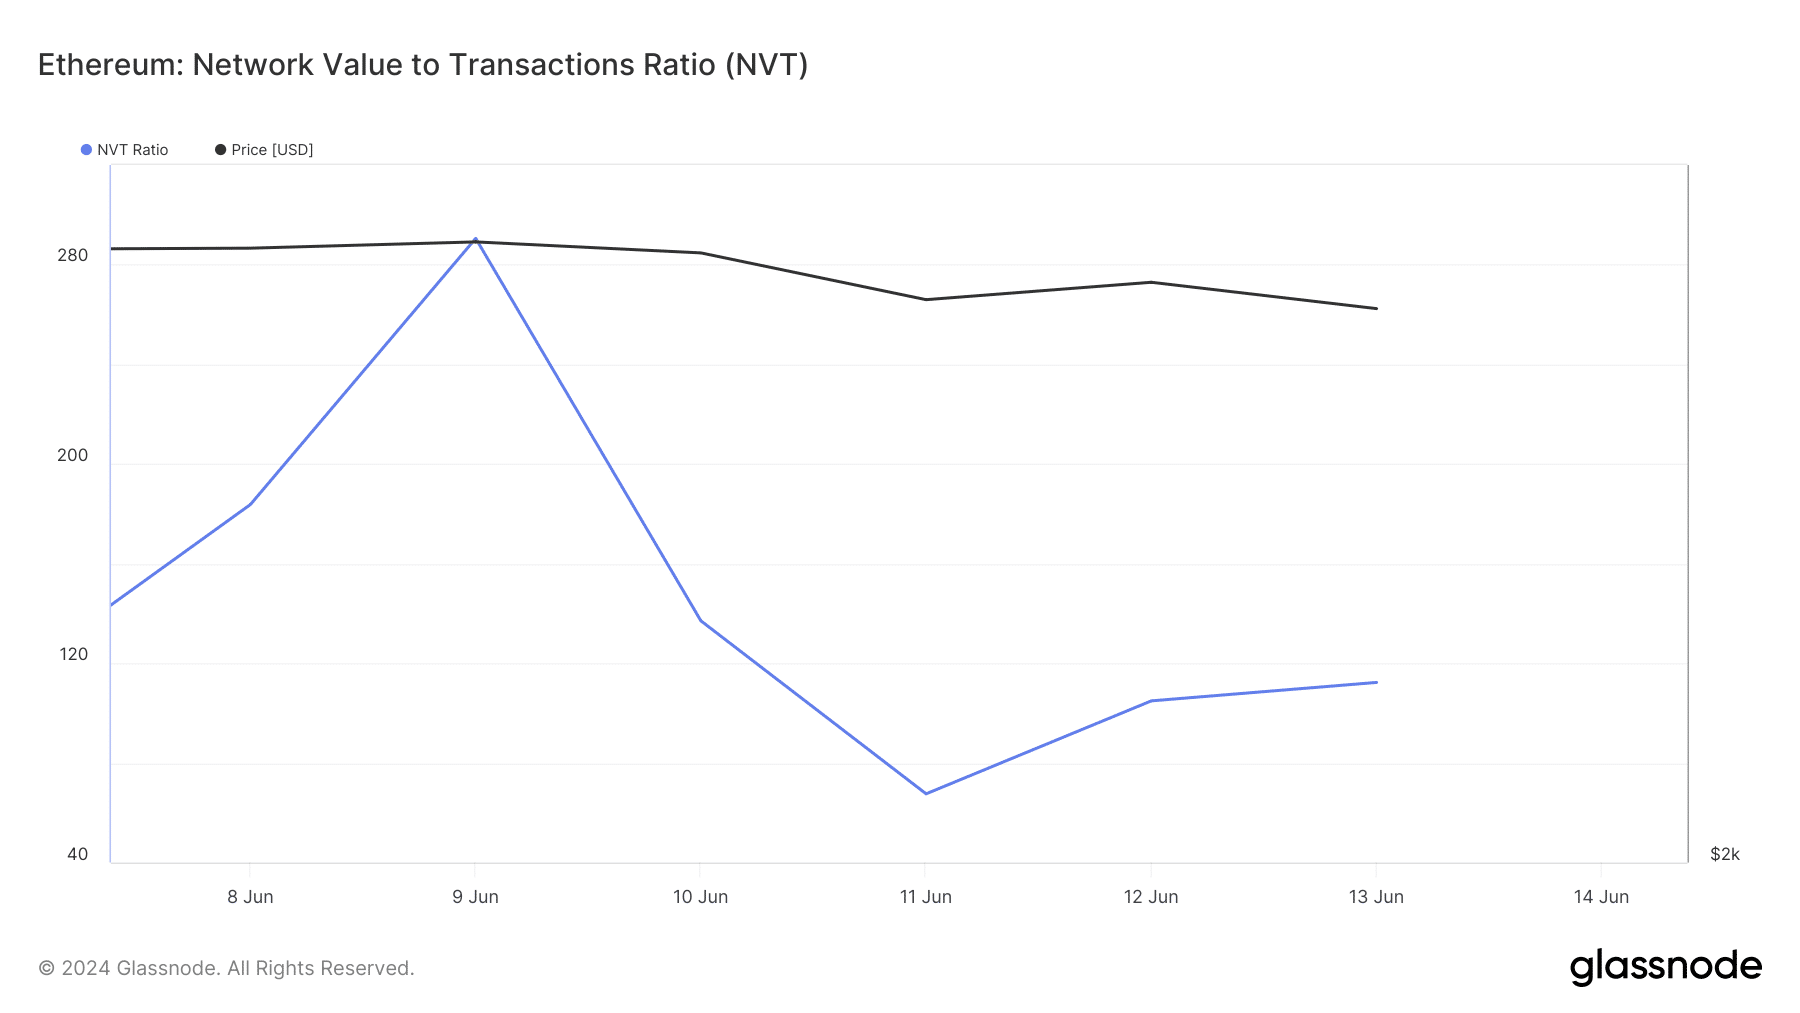
Source: Glassnode
Ethereum’s price touched the lower limit of the Bollinger Bands, hinting at a rebound. Moreover, its Relative Strength Index (RSI) also registered an uptick and was headed towards the neutral mark.
Nonetheless, the MACD displayed a bearish advantage in the market, which could cause trouble for ETH’s recovery.
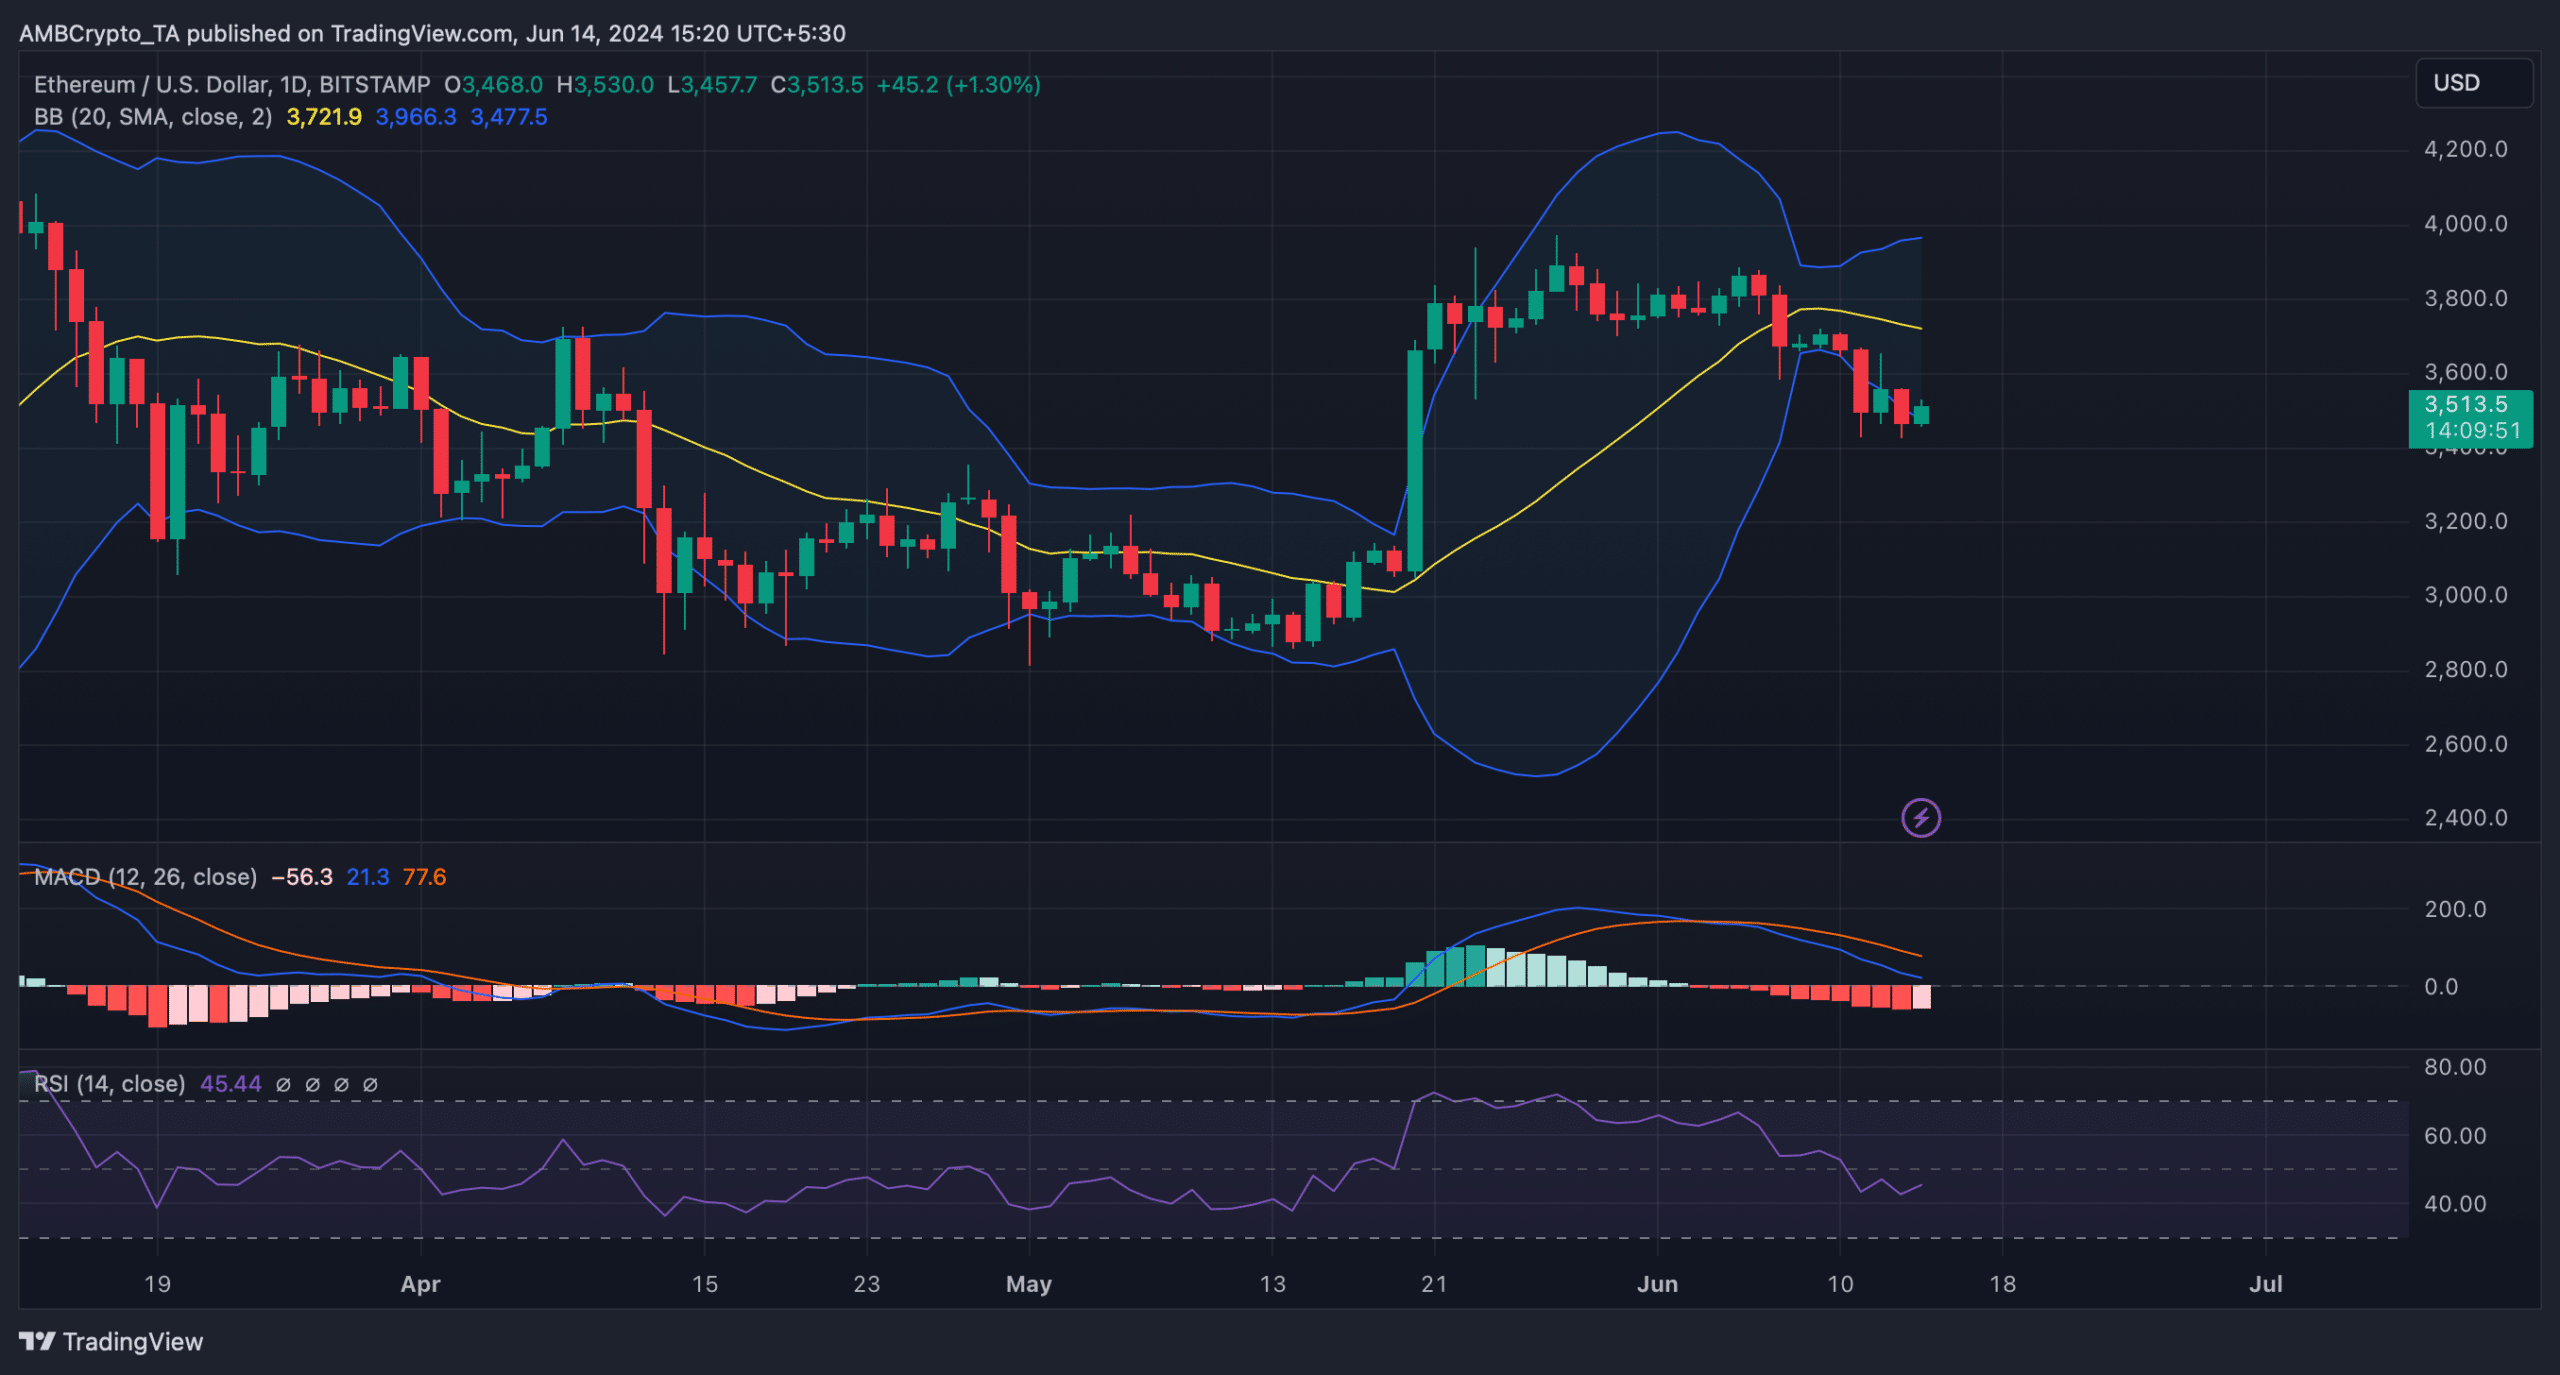
Source: TradingView
Read Ethereum (ETH) Price Prediction 2024-25
AMBCrypto then checked ETH’s liquidation heatmap to look for possible support and resistance levels. We found that if ETH turns bullish in the coming days, investors might witness ETH touch $3,675 in the coming days.
However, if ETH fails to test the bullish flag pattern, then the token might drop to $3,500 in the short term.

Source: Hyblock Capital