Ethereum’s correction – $2,700 and ETH price’s other targets if it falls again
Ethereum’s price failed to hold above $3.2k. If it corrects further, how far down will it go now?

- Selling pressure on Ethereum rose over the past week
- Most market indicators looked bearish on ETH’s charts
Ethereum’s [ETH] price managed to climb past $3.2k last week. Soon after, however, the altcoin turned bearish as ETH was unable to hold its position on the charts. Given how everything has panned out, if the worst scenario is to be considered here, ETH might fall to its $2.7k support level.
More red for Ethereum
According to CoinMarketCap, ETH’s price appreciated by 2% last week, allowing it to go past $3.2k on 24 April. However, the uptrend didn’t last long as its price dropped over the last 24 hours. At the time of writing, ETH was trading at $3,118.13 with a market capitalization of over $380 billion.
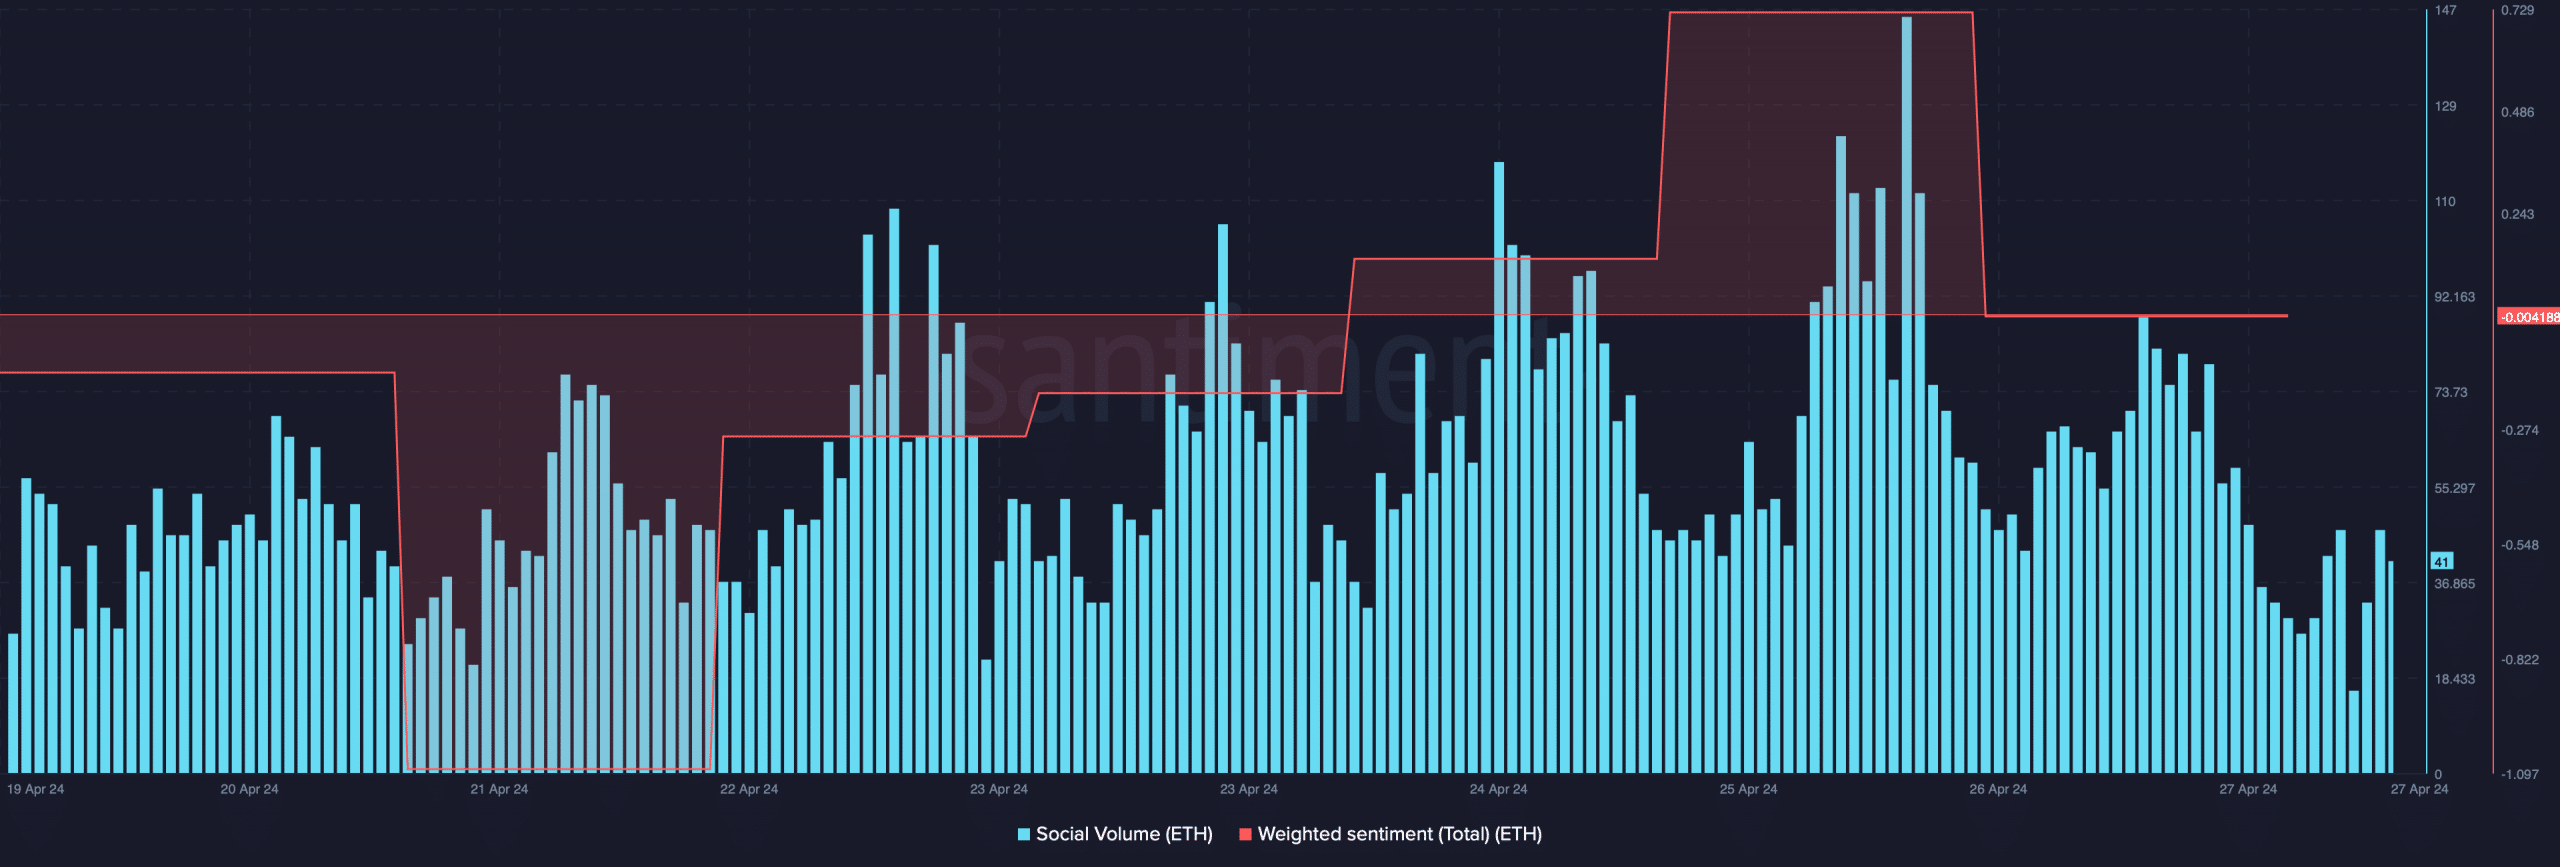
According to IntoTheBlock’s data, 79% of Ethereum investors are still in profit. The decline in ETH’s price also affected its social volume negatively. Additionally, after a spike on 25 April, its weighted sentiment dropped on the charts. This alluded to bearish sentiment around ETH being on the higher side.
Things can get worse, however, as if ETH records more price corrections, its value might drop to the $2.7k support level in the coming days, as per a recent tweet from Crypto Tony, a popular crypto analyst. The possibility of ETH hitting that support level would increase if it fails to go above $3.6k.
Therefore, AMBCrypto took a look at Santiment’s data to see whether metrics seemed bearish.
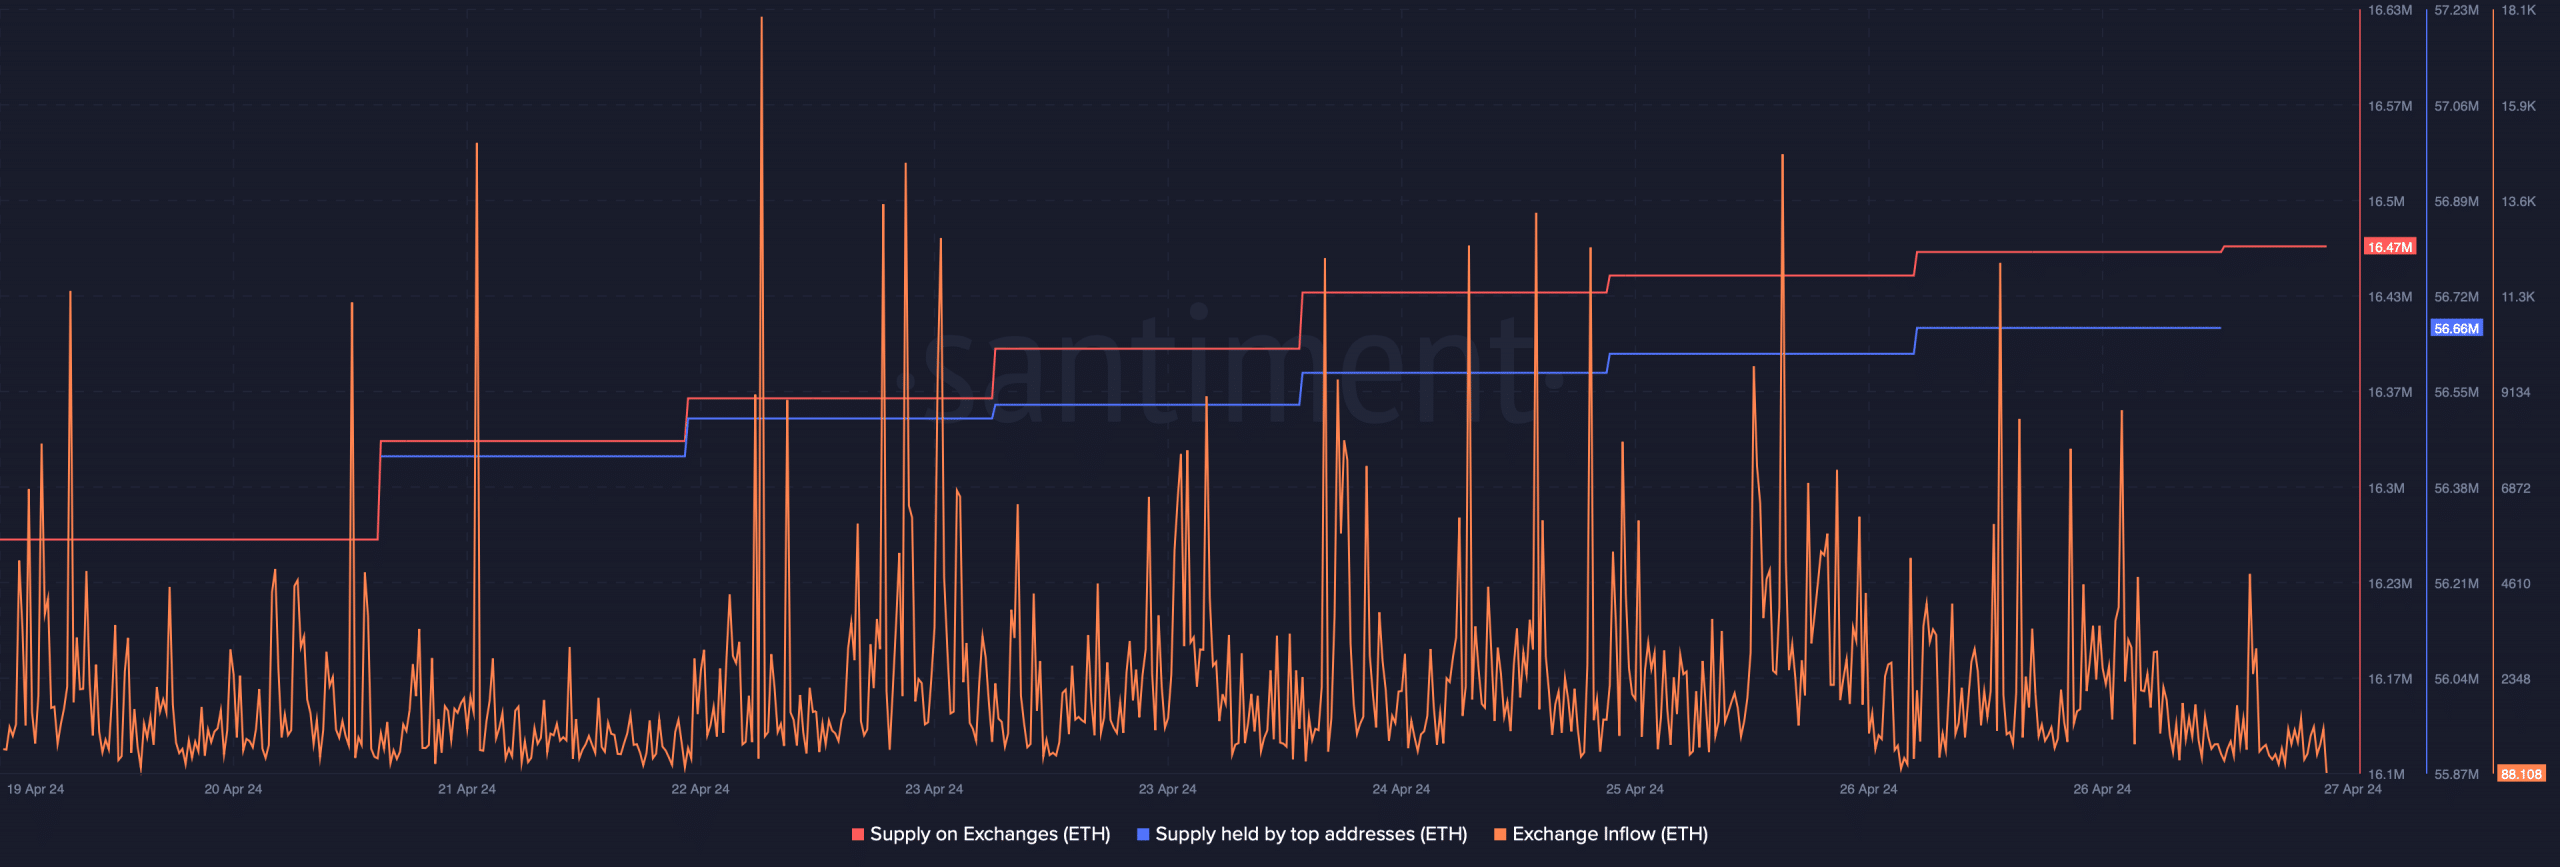
We found that selling pressure on the token has been increasing. This was evidenced by the hike in its exchange inflows over the past week. The fact that selling pressure was high was further proven by ETH’s supply on exchanges, which rise.
On the contrary however, whales remain confident in ETH as its supply held by top addresses went up.
Ethereum’s immediate support levels
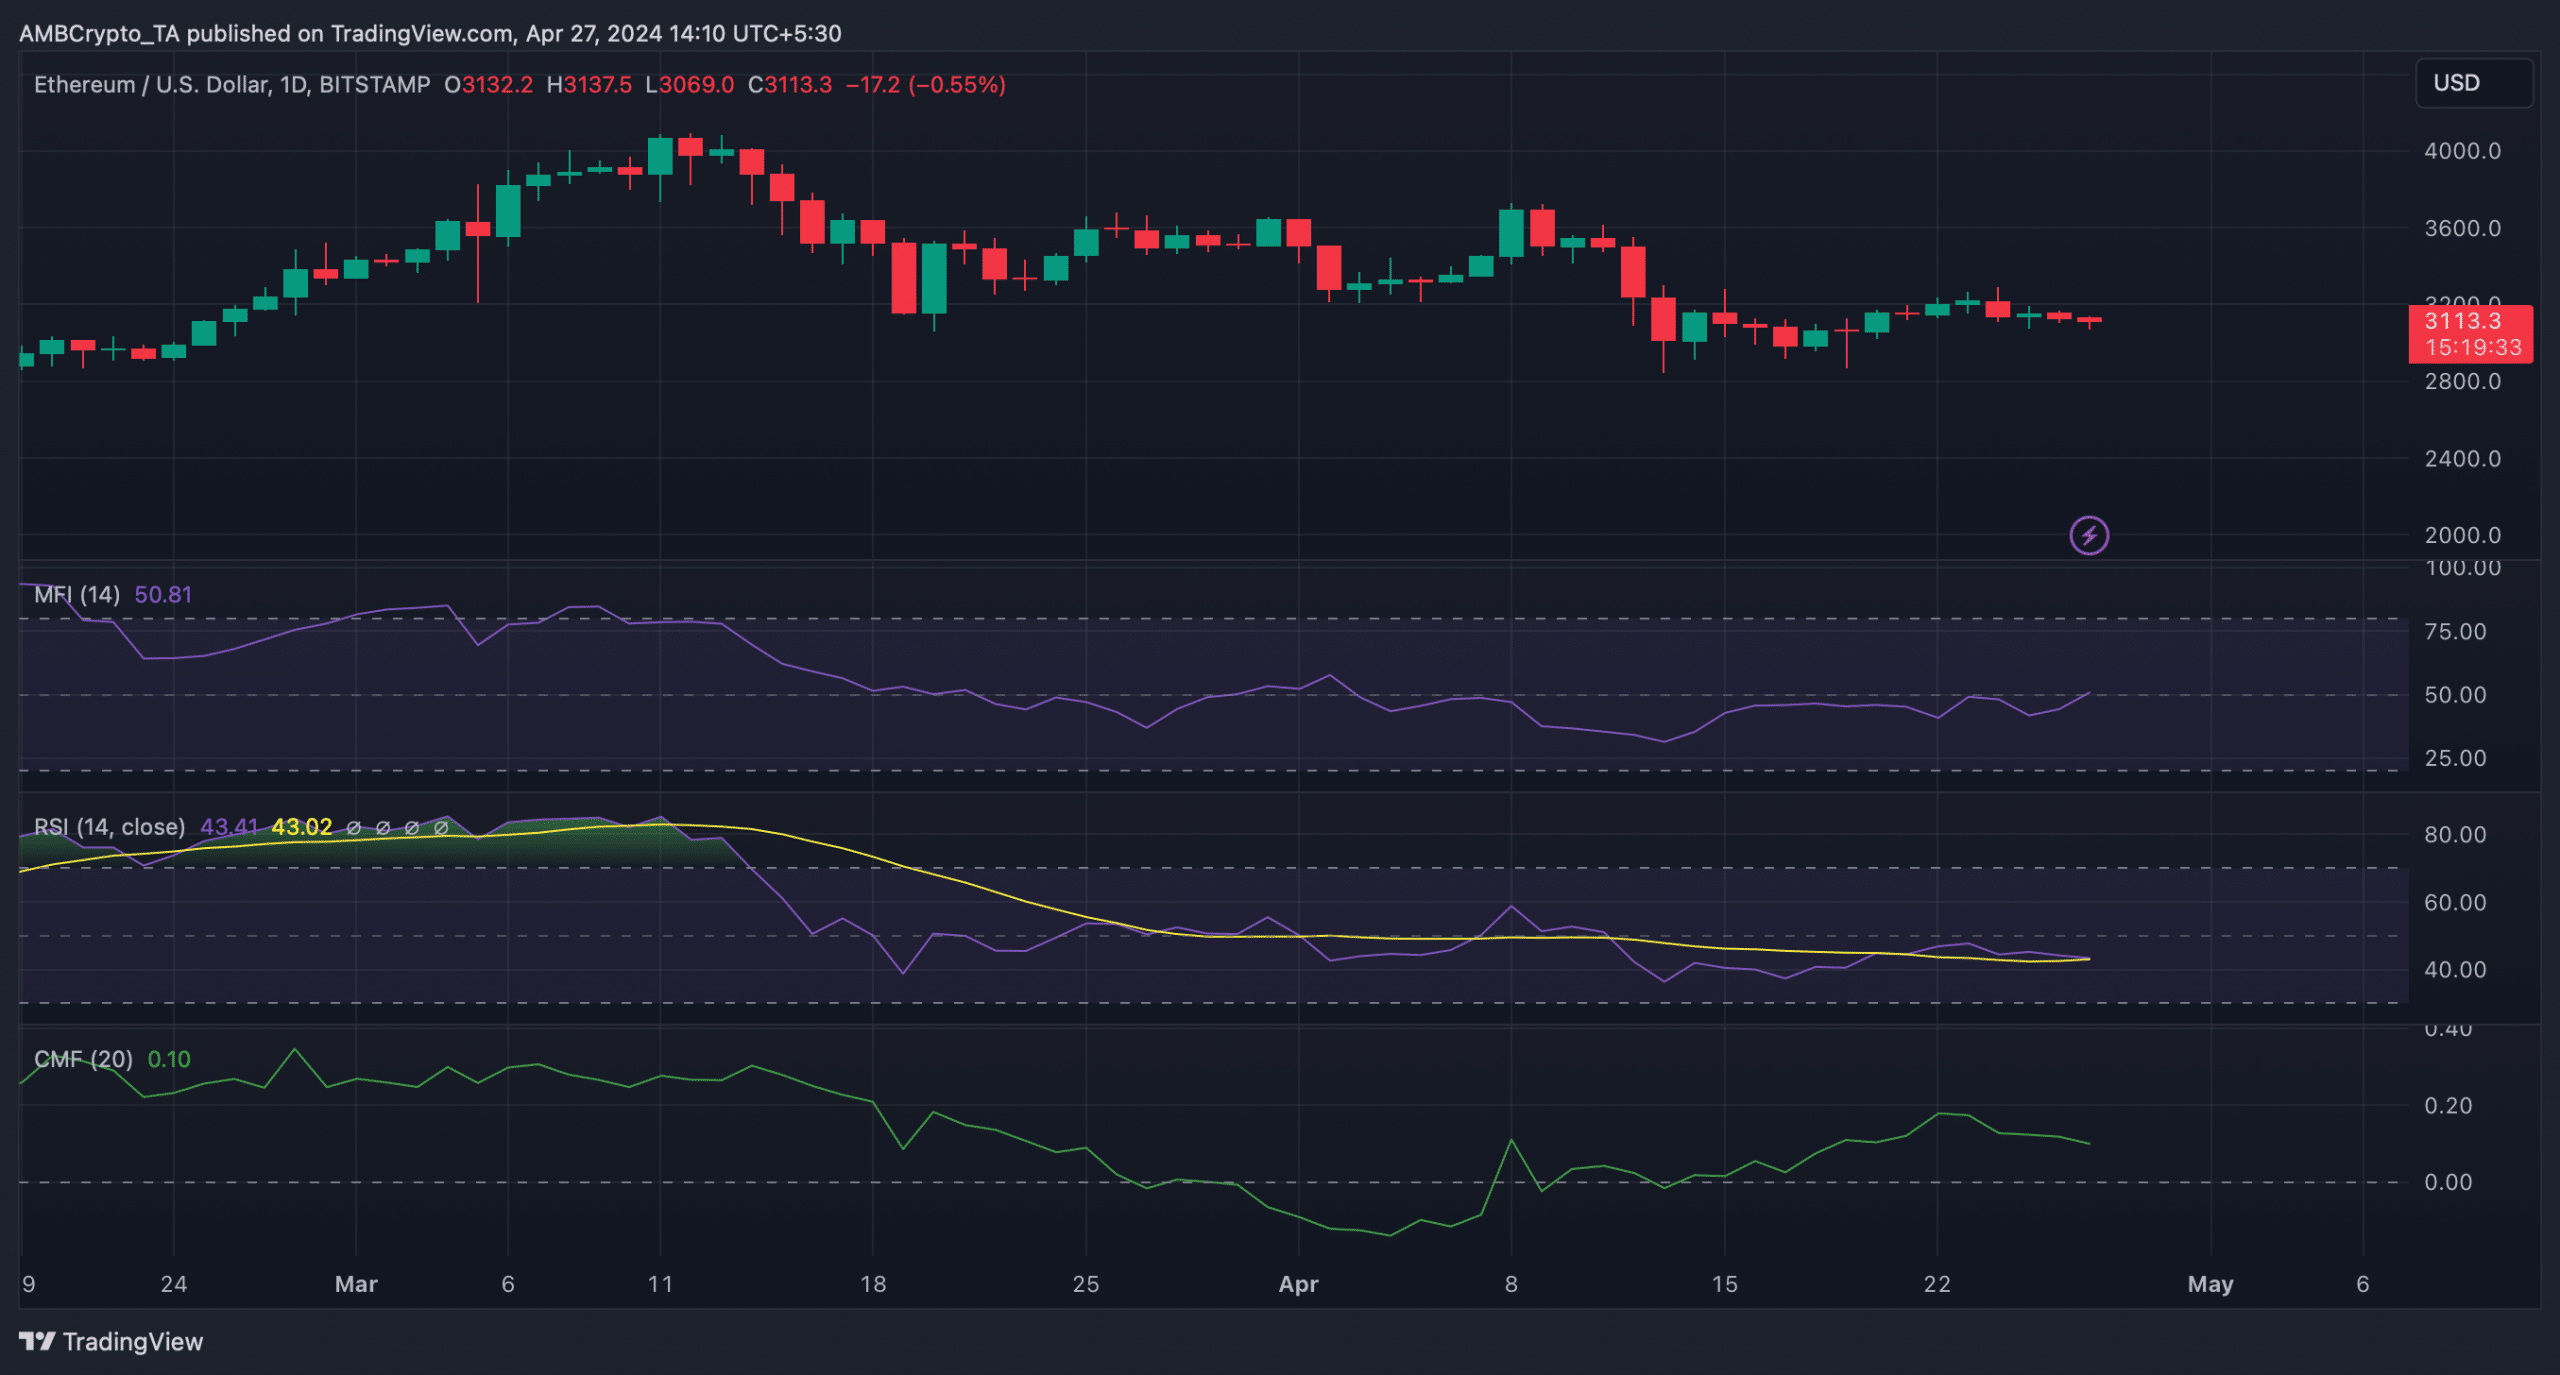
AMBCrypto then checked ETH’s daily chart to find whether a sustained downtrend is inevitable or not. We found that the Money Flow Index (MFI) went north – A sign predicting a price uptick.
Nonetheless, the rest of the indicators seemed bearish. For instance, both ETH’s Relative Strength Index (RSI) and Chaikin Money Flow (CMF) headed south, meaning that the chances of a further price drop were high.
Is your portfolio green? Check the Ethereum Profit Calculator
Finally, AMBCrypto’s analysis of Hyblock Capital’s data revealed that ETH has a strong support level near $3.1k if a price correction happens.
A drop below that level could result in ETH plummeting to $2.8k before it reaches its tested support level at $2.7k in the coming days or weeks.


