Ethereum
Ethereum’s exchange supply hits an 8-year low – Only 10% left!
Ethereum has become more scared on exchanges, but could this help its price rebound?


- The percent of ETH supply on exchanges has dropped to an eight-year low.
- ETH rebounded from its decline in the previous trading session.
Not only has Ethereum’s [ETH] price declined in the last few days, but its supply on exchanges has also decreased. This decline aligns with the trend in its Netflow, which has seen a dominance of outflows over the past few days.
What percentage of ETH is left on exchanges?
The Ethereum balance on exchanges has been declining over the past few weeks, with this decline becoming more prominent towards the end of the previous month.
An analysis of the chart on Glassnode showed that it recently declined to around 10.19%.
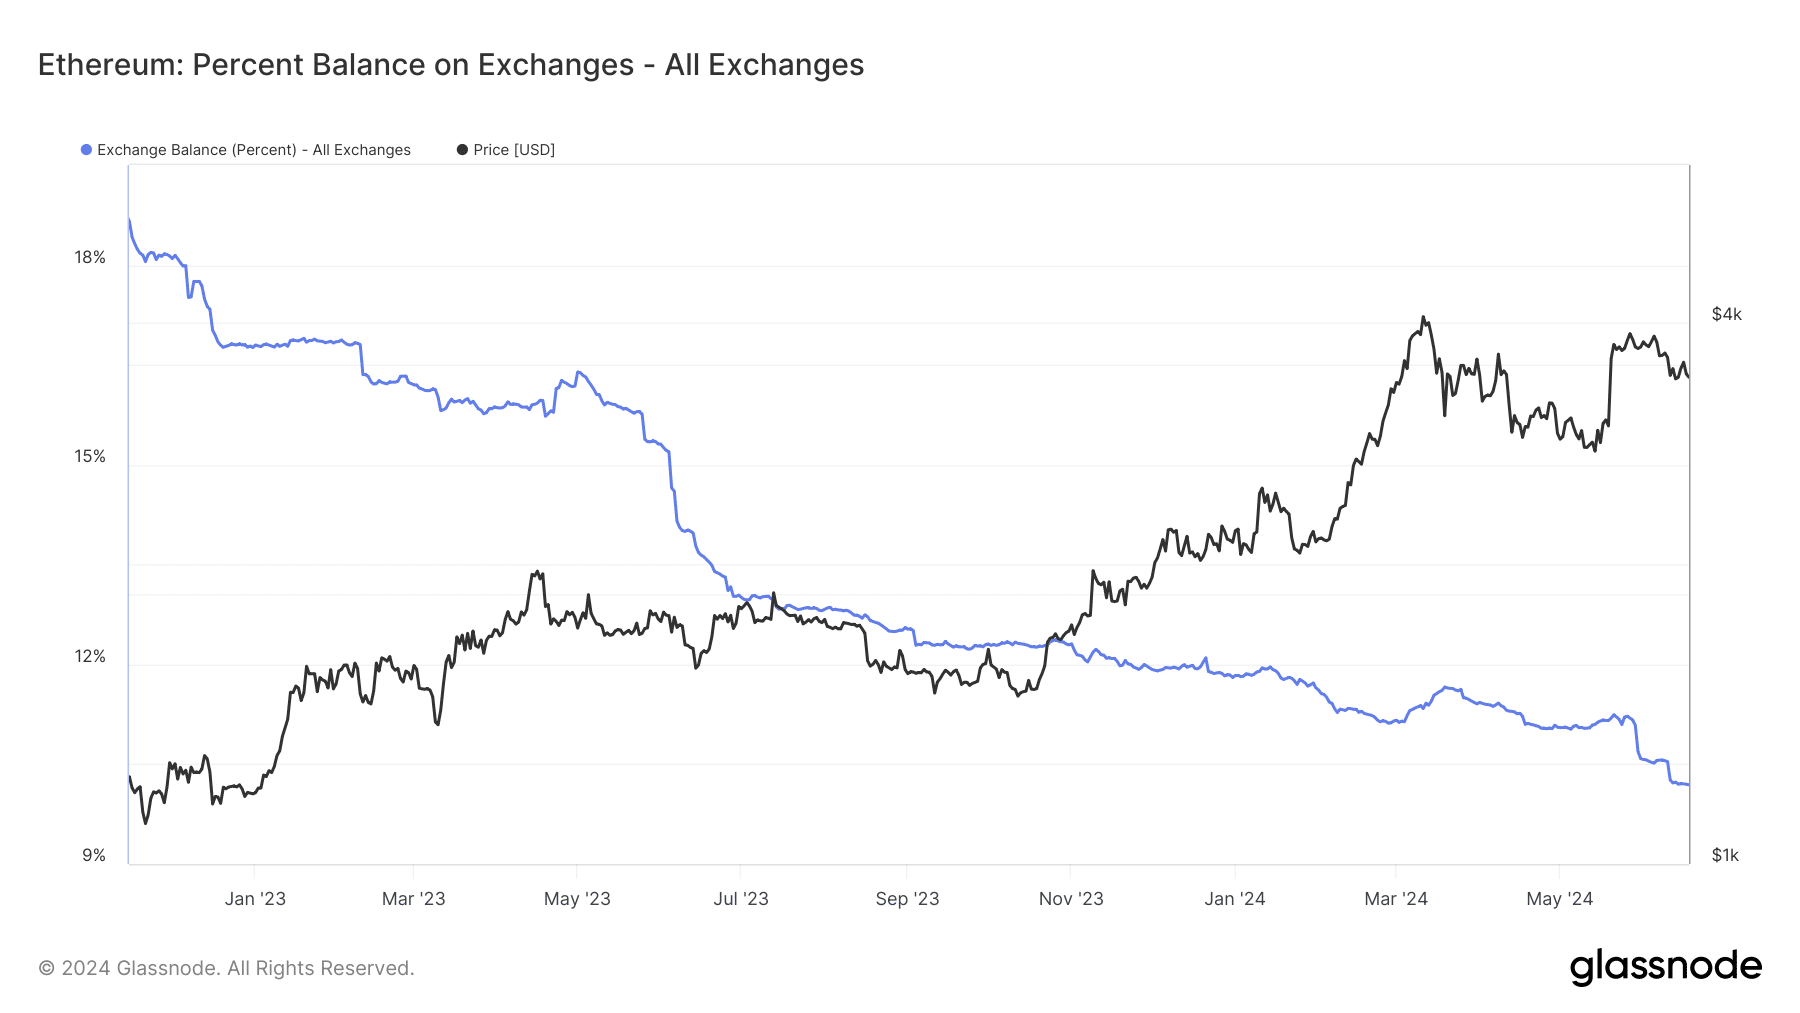
Source: Glassnode
Analysis showed this was the lowest percentage supply on exchanges in about eight years.
A study of the chart indicated that this was the first time since 2016 that the supply dropped to this level. The decline means that addresses holding ETH on exchanges have withdrawn their holdings.
The decrease in supply over the last few weeks is a positive sign for ETH, suggesting reduced selling pressure and potential accumulation by holders.
More Ethereum leave exchanges
An analysis of the exchange flow showed a dominance of outflows in the last few days. As of this writing, the netflow is -1,481, indicating that more Ethereum
has left exchanges than has come in.This current Netflow trend aligns with the exchange balance, which shows a reduced amount of ETH remaining on all exchanges.
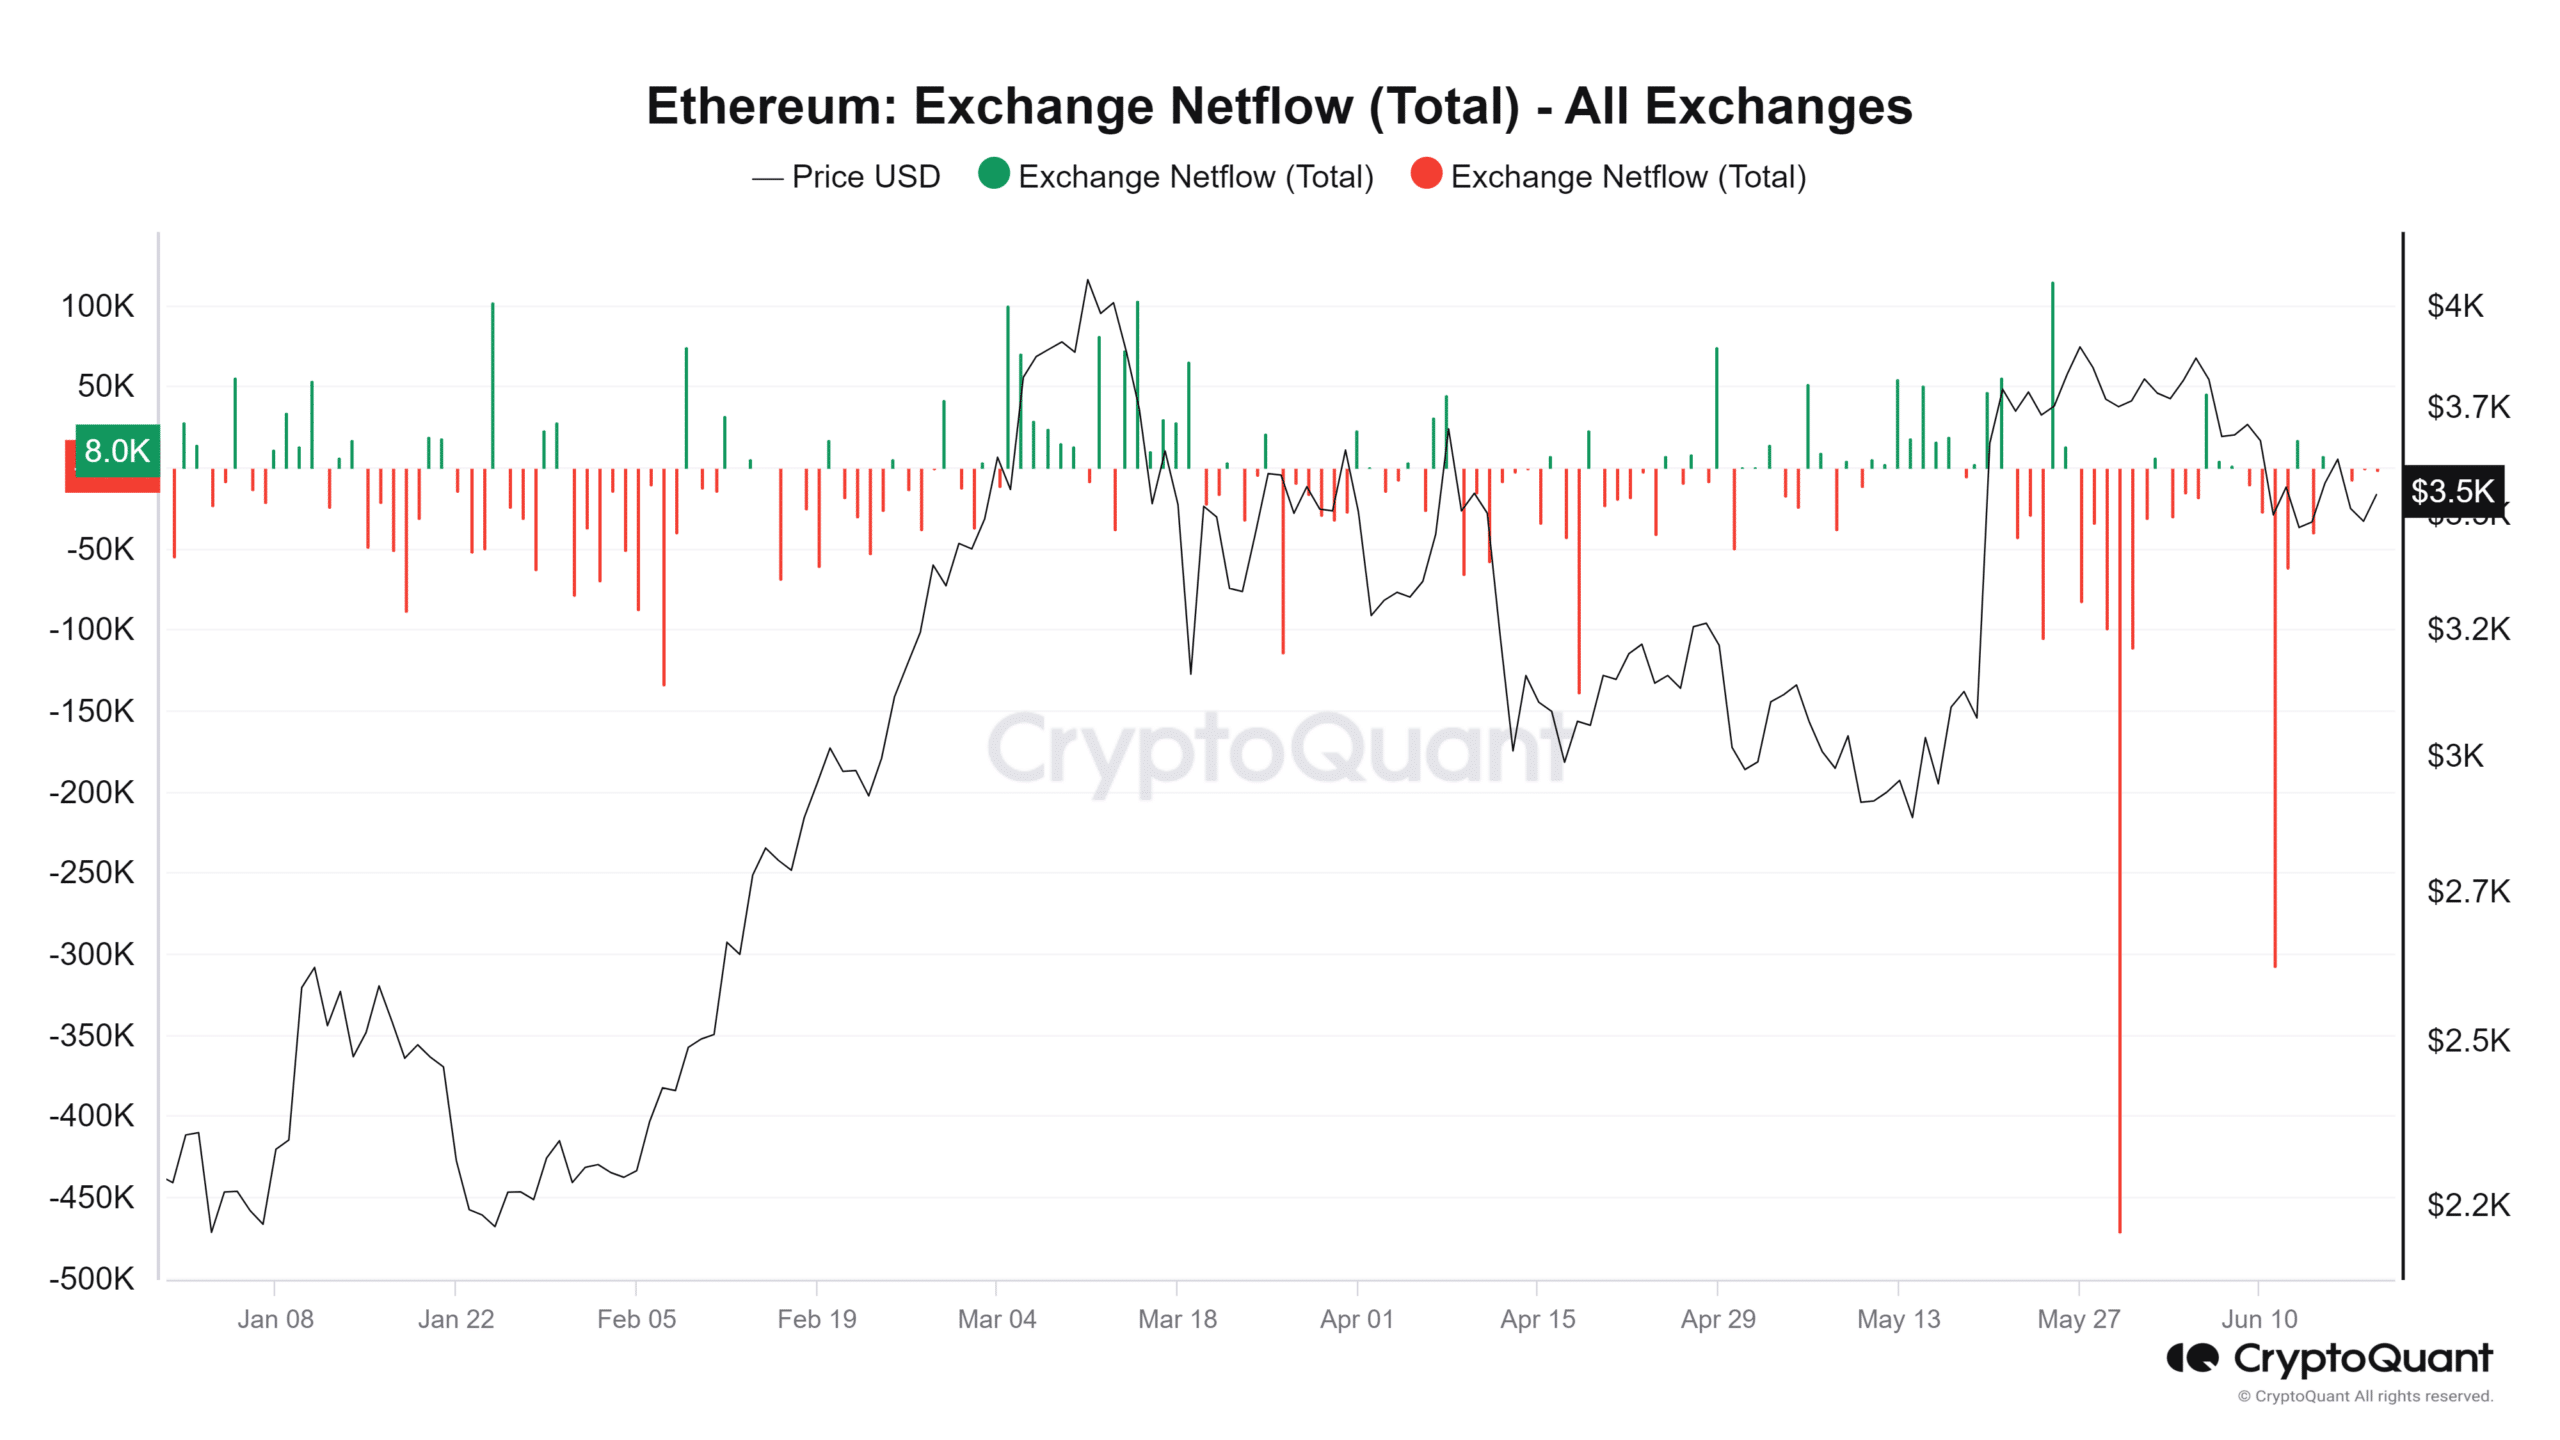
Source: CryptoQuant
Analyzing the ETH price trend
As of this writing, Ethereum was trading at around $3,540, with an increase of approximately 1.7%. An analysis of its daily time frame shows an improvement from the previous trading session.
Read Ethereum’s [ETH] Price Prediction 2024-2025
In the last session, its price dropped to $3,400 after declining by less than 1%. This decline followed another decline in the session before that.
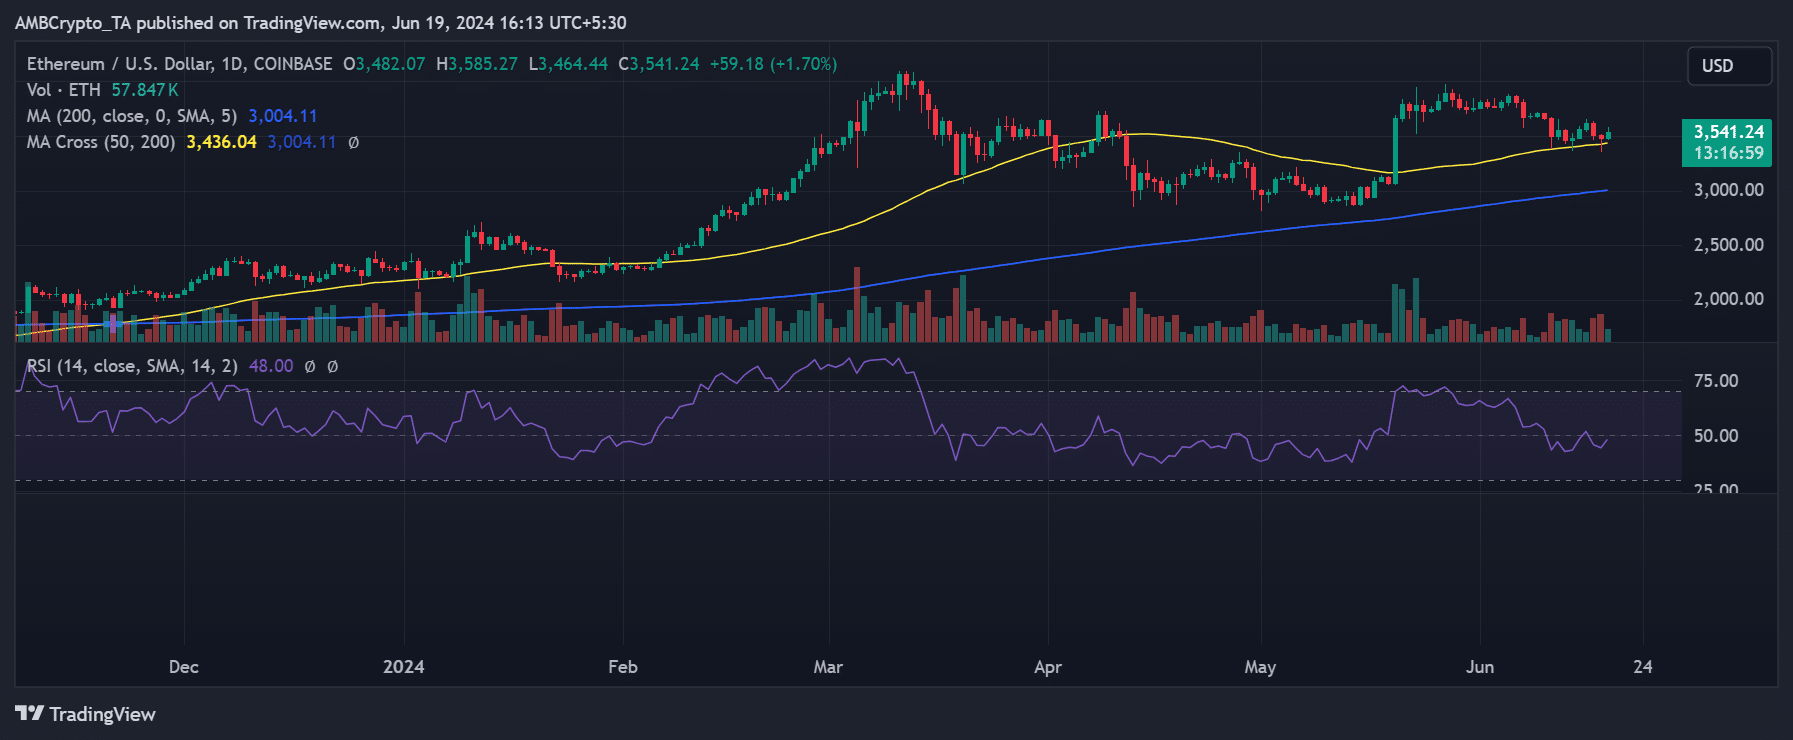
Source: TradingView
Additionally, Ethereum’s Relative Strength Index (RSI) analysis showed a positive move. The chart indicated that its RSI was now close to the neutral line. This suggests that the bear trend is weakening as of this writing.