Ethereum
Ethereum’s fails to duck out of bear’s grip
Ethereum [ETH], the second largest cryptocurrency by market cap was priced at $178.85. The virtual asset dropped by 1.69% in the last 24-hours. With the market cap of $19.25 billion, the digital asset recorded $6.09 billion as the 24-hour volume. Most of the volume was generated over CoinEgg exchange via trading pair, LTC/ETH.
1-hour chart
In the one-hour chart, ETH formed support at $177.87 and $168.51. The digital asset faced resistance at $183.48. ETH recorded a sharp downtrend from $193.22 to $183.17.

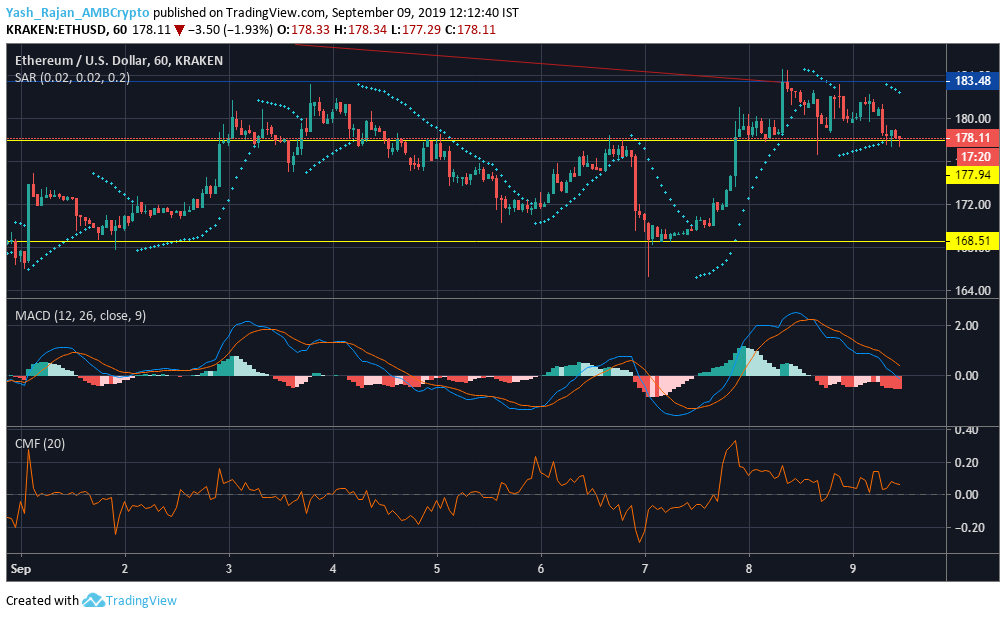
Source: TradingView
Parabolic SAR indicated bearish traits as the dotted markers were present above the candles.
The MACD line crossed below the signal line, pointing towards a bearish outbreak.
Chaikin Money Flow line was positioned at 0.05. As it remained above the zero-line, it pointed that higher amount of capital was flowing into the market.
1-day chart
ETH faced resistance at $336.44 as support line stood at $168.51. The coin faced an uptrend from $157.66 to $335.65. The coin also witnessed a downtrend from $312.50 that extended to $179.378.

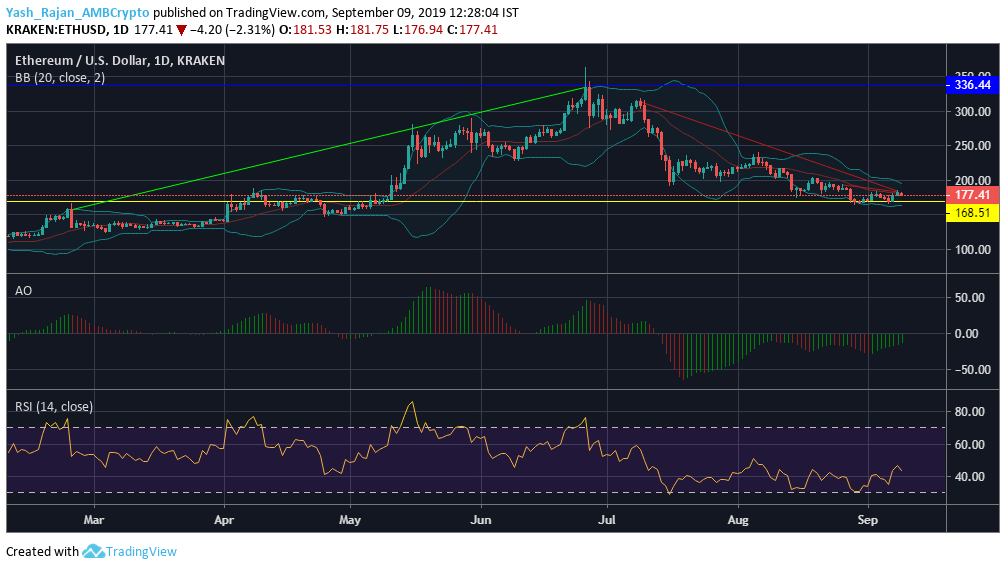
Source: TradingView
The Bollinger Bands were squeezed, depicting reduced volatility in the market.
Awesome Oscillator indicated a bearish setting opportunity as long-term momentum was greater than the short-term momentum. The appearance of green lines further indicated the possibility of a bullish market.
The RSI indicator indicated that ETH is very close to being overbought.
Conclusion
Despite the fact that ETH showed good signs of growth in the market, the long-term graph demonstrated a bearish market as the price was diminishing.