Ethereum’s ‘fake breakdown’ spotted – What does it mean for ETH’s next move?

- Large transaction volume for ETH has jumped by 58.63%, indicating a bullish outlook.
- ETH could soar by 15% to reach the $2,855 level if it closes a daily candle above the $2,465 level.
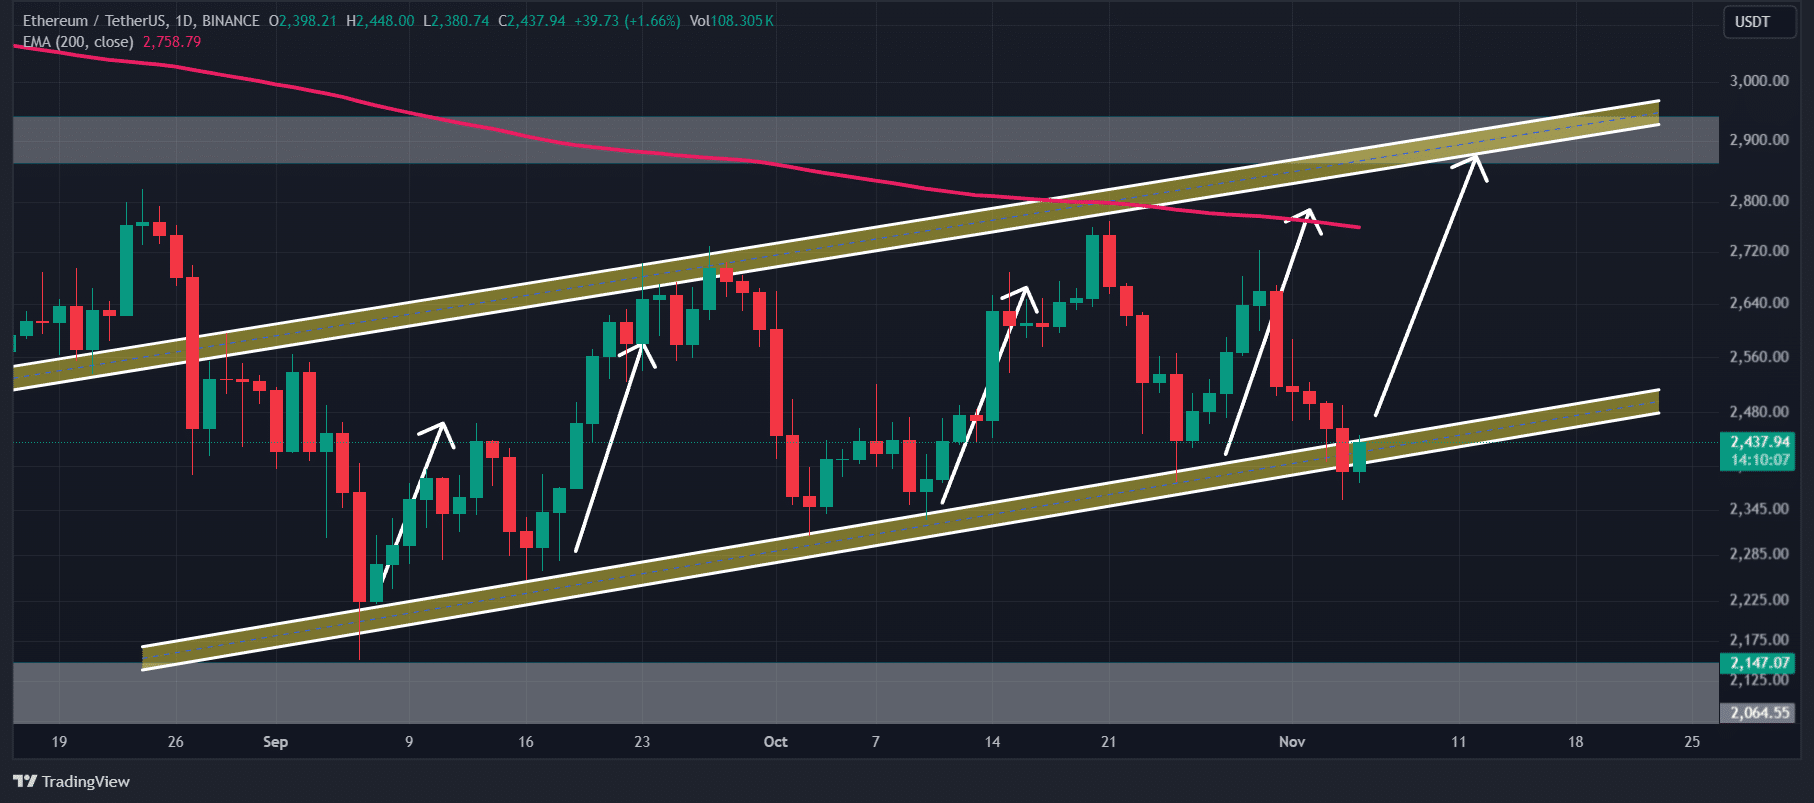
Amid the ongoing struggles in the cryptocurrency market, Ethereum [ETH] experienced a breakdown from a bullish channel pattern, though this appears to be a fakeout as the price has once again moved back within the pattern.
Along with ETH, the overall cryptocurrency market has been struggling significantly to gain momentum. However, the potential reasons for this struggle include the U.S. presidential election, geopolitical tensions, and other factors.
Ethereum technical analysis and key-level
AMBCrypto suggests that ETH is bullish and could see significant gains in the coming days. Currently, the asset is at a crucial support level, or we could say the lower boundary of a bullish parallel channel pattern.
Historically, whenever the price reaches this level, it experiences buying pressure and an upside rally.
This time, however, investors and traders are expecting a similar price rally in the coming days. Based on recent price action, if ETH closes a daily candle above the $2,465 level, there is a strong possibility the asset could soar by 15% to reach the $2,855 level in the coming days.
ETH’s bullish thesis will only be as long as ETH trades above $2,400, otherwise, it may fail.
Bullish on-chain metrics
On-chain metrics further support ETH’s positive outlook, indicating potential strength in the asset.
However, it has been also witnessed that despite market uncertainty and notable volatility the participation from whales and investors has skyrocketed.
According to the on-chain analytics firm IntoTheBlock, large transaction volume for ETH has jumped by 58.63%, indicating a bullish outlook.
Meanwhile, ETH’s Long/Short ratio currently stands at 1.055, the highest since October 21, 2024. A ratio above 1 indicates a strong bullish sentiment among traders. Additionally, open interest has remained unchanged over the past 24 hours, suggesting that traders have safeguarded their positions despite the recent price decline.
Read Ethereum’s [ETH] Price Prediction 2024–2025
Traders sentiment
The combination of on-chain metrics and technical analysis suggests that bulls are currently dominating the asset and may support a significant rise in ETH in the coming days.
At press time, ETH was trading near $2,440 and has experienced a modest price decline of 0.75% over the past 24 hours. During this same period, its trading volume jumped by 24%, suggesting increased participation from traders and investors amid the recent price decline.


