Ethereum’s imminent bullish breakout may lack momentum to retest major resistance

Over the past week, Ethereum’s price has undergone major consolidation. ETH’s price registered a change of only 0.73 percent and many speculate that the token’s price will enter a major accumulation period. On 4 November, Ethereum recorded an hourly hike of over 2 percent, but corrections quickly stabilized its valuation. Upon analysis, it was observed that bullish traits were evident, but a deficiency in momentum may hinder its price growth.
4-hour chart

Source: ETH/USD on Trading View
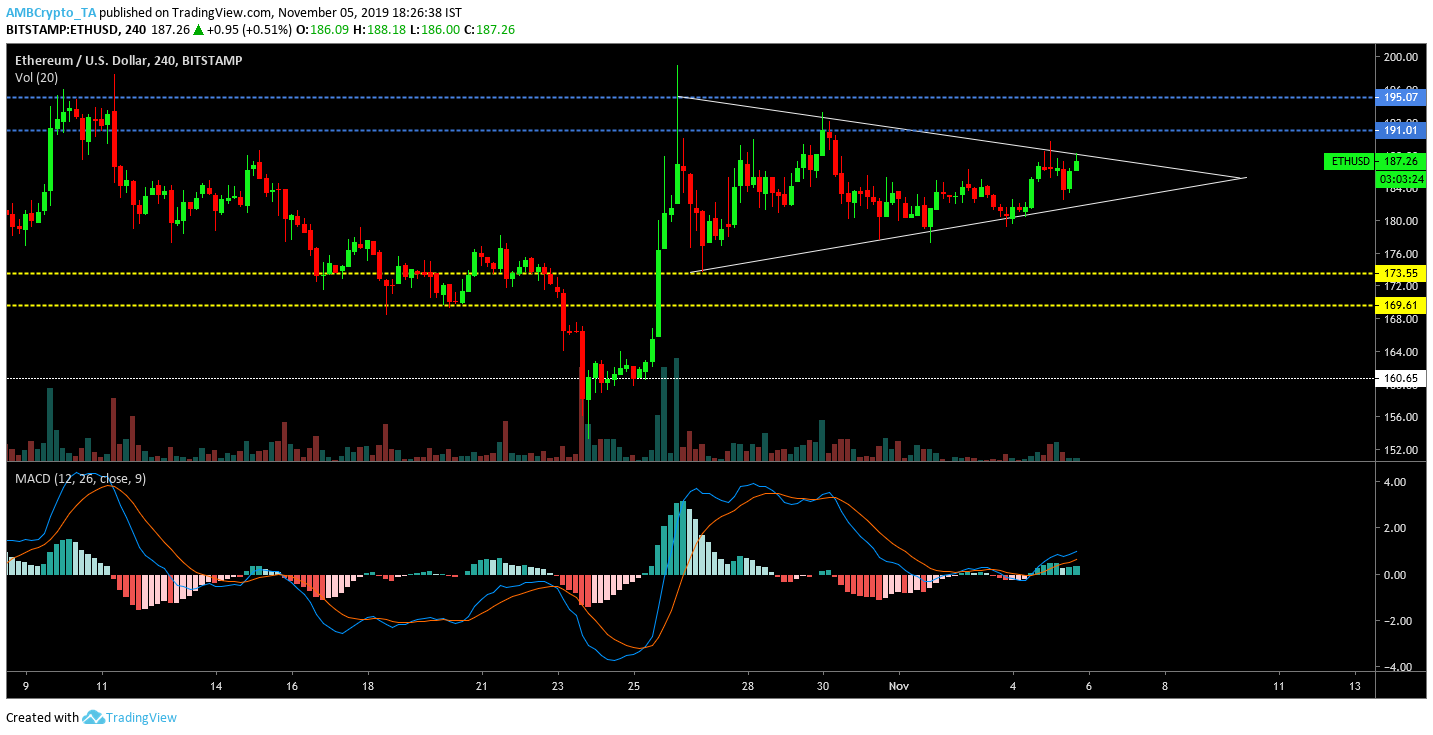
The 4-hour chart for Ethereum suggested that ETH’s price movement had given rise to a symmetrical triangle pattern which indicated that a breakout was possible towards both sides of the spectrum. The immediate resistance for Ethereum was placed at $191.01, and the long-term resistance continued to be at $195.07. Ethereum had managed to breach the $200 psychological mark previously, but a lack of momentum indicated its failure to maintain a position above its resistance. The depreciating trading volume should register a hike, once the breakout surfaces on the chart.
The MACD indicator was bullish for ETH at press time, another sign of the possibility of a bullish push.
1-hour chart

Source: ETH/USD on Trading View
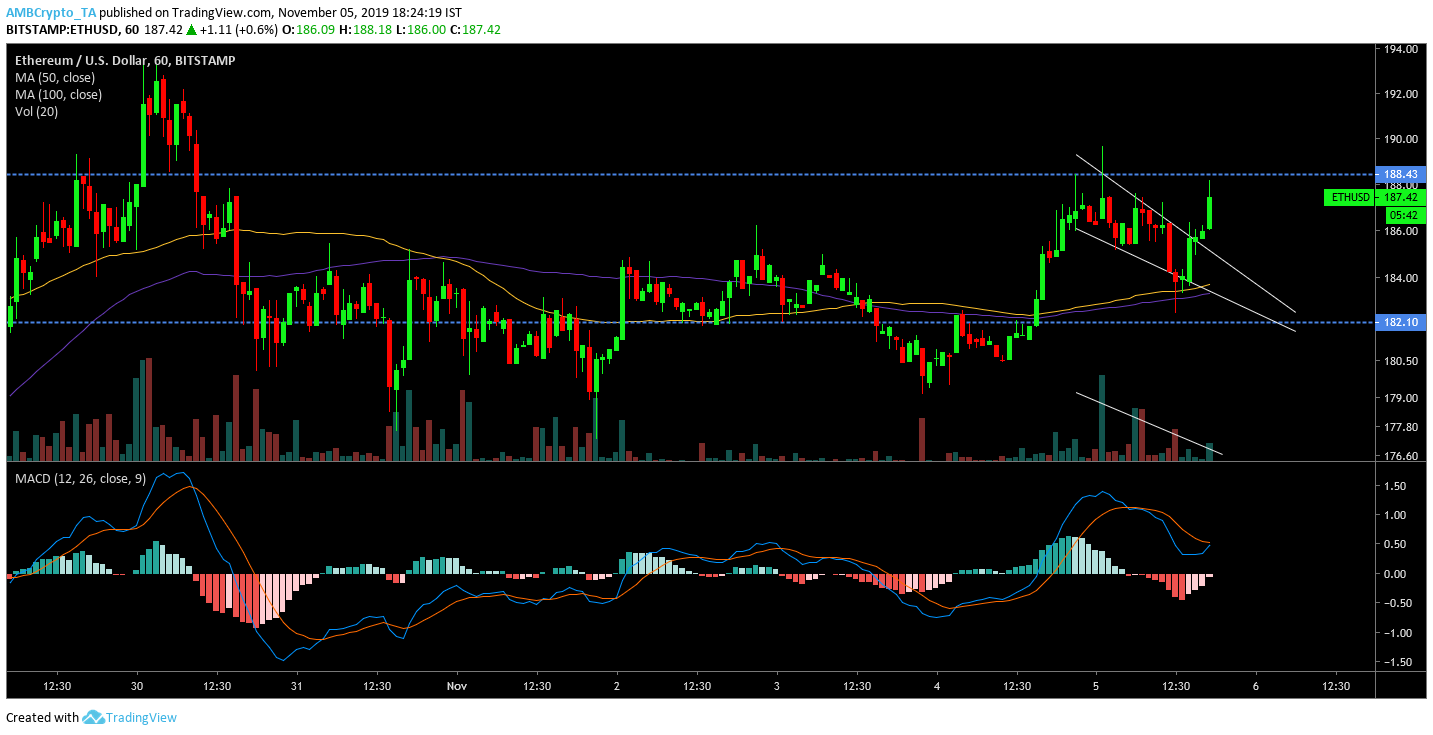
The 1-hour chart for ETH pictured the occurrence of a bullish break. A falling wedge pattern was breached at press time, and the price movement of ETH navigated a hike. The decreasing trade volume confirmed the pattern’s validity, but bullish momentum was weak for ETH. The 50-Moving Average moved above the 100 Moving Average, highlighting the bullish nature of ETH.
The MACD indicator suggested that a trend reversal was imminent as the MACD line approached a bullish crossover with the signal line. The price movement on the 1-hour chart raised the possibility of a bullish break on the 4-hour chart, the latter of which conveyed a neutral tone, at press time.


