Ethereum
Ethereum’s price may rise as the bullish signs gain strength
Ethereum’s journey in the crypto market might have digressed a little, but has come back to tack, as it noted a growth of 18.08% over the past week. However, the price of the coin has been correcting itself and stands at $216.65, at press time as it suffered a fall of 1.68% in the past 24-hours. The market cap of ETH was $23.36 billion while its 24-hour trading volume was registered to be $7.85 billion.
1-hour

Source: Trading view
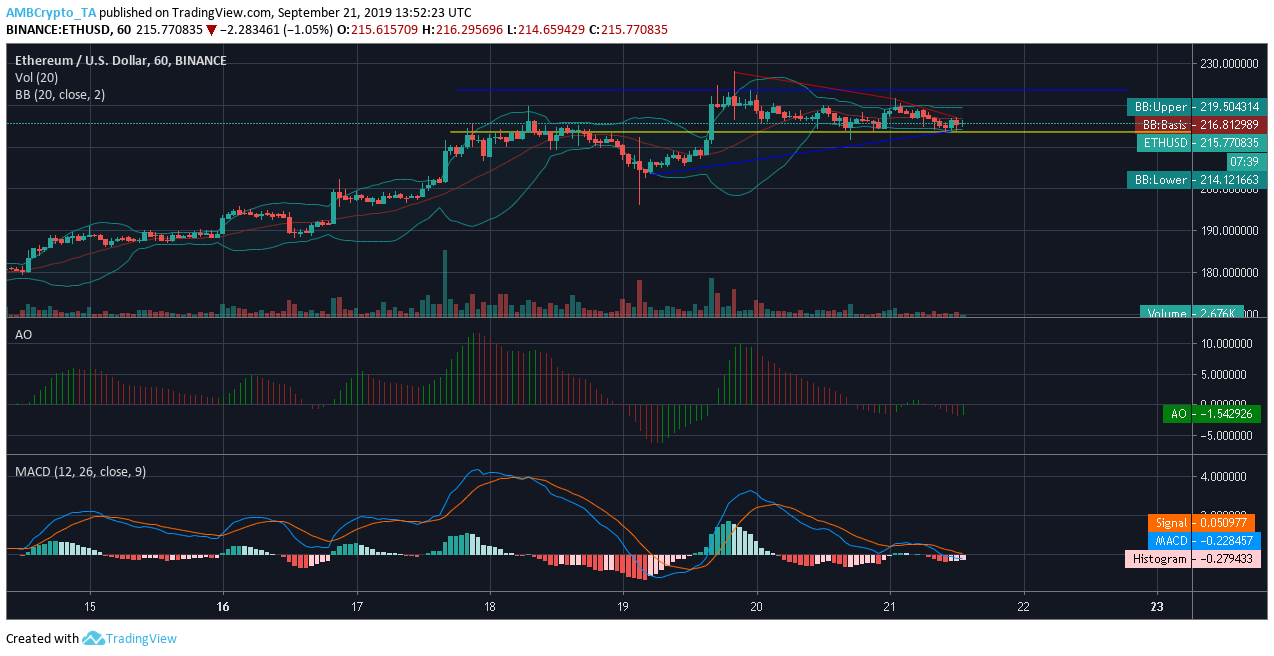
Resistance- $223.68
Support- $213.63
1-hour chart of ETH indicated towards a falling price of the coin. It slid from $227.92 to $217.09.
Bollinger Bands appeared to have converged, with the moving average resting under the candlesticks pointing towards a bearish market.
Awesome Oscillator suggested strong bullish momentum in the market
MACD line rested under the signal line indicating a bearish sign.
1-day
Source: Trading view
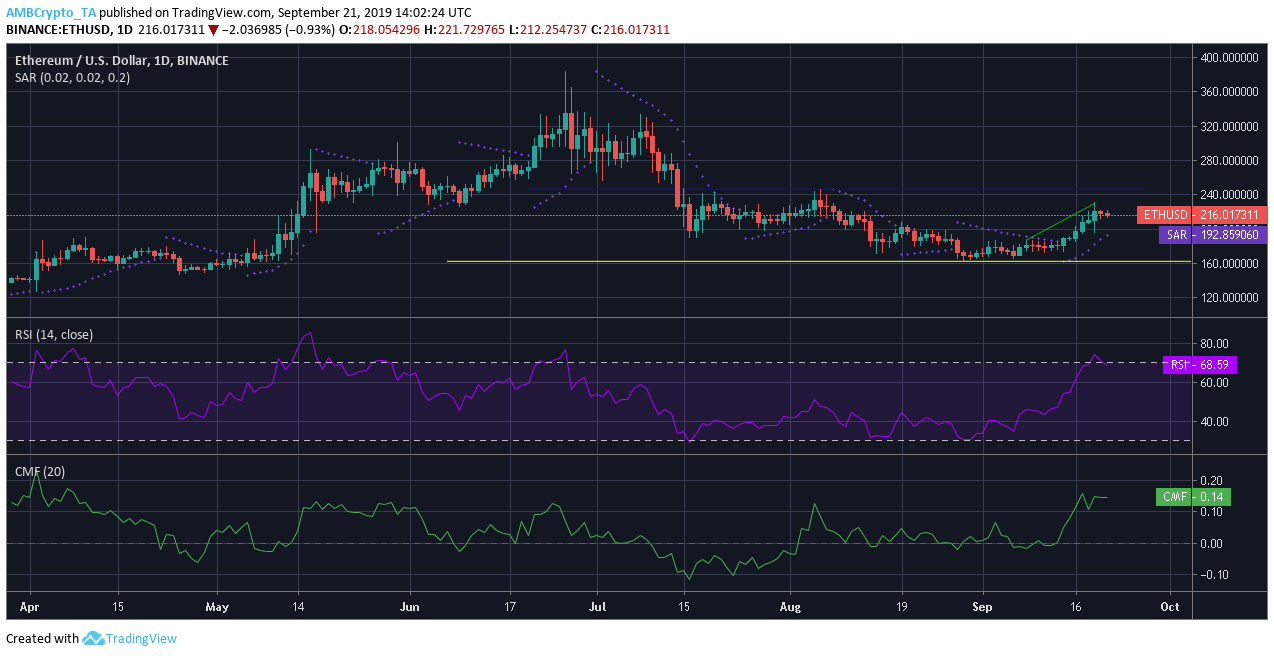
Resistance- $246.45
Support- $162.49
Parabolic SAR marked a bearish reign as the markers aligned under the candlesticks.
Relative Strength Index was observed to be in the overbought zone but was slowly entering the equilibrium zone.
Chaikin Money Flow reflected a bullish sign as the signal line was above zero, meaning the money was flowing in the market.
Conclusion
The hourly and daily chart of Ethereum gives a picture of a bullish market making its way. However, the bears are not completely out of sight.