Ethereum
Ethereum’s price witnesses major dip as valuation falls below $170 range
It has been an underwhelming week for Ethereum price’s as the token witnessed a major fall on 29th August as the coin dropped about 6 percent in an hour. At press time, Ethereum was valued at $168.43 and the market cap of the 2nd largest virtual asset was around 18.2 billion.
CoinEgg was responsible for the highest trade volume for the asset on the trading pair of ETH/LTC and in the past 24-hours, Ethereum price had dropped by -0.35 percent.
1-hour chart

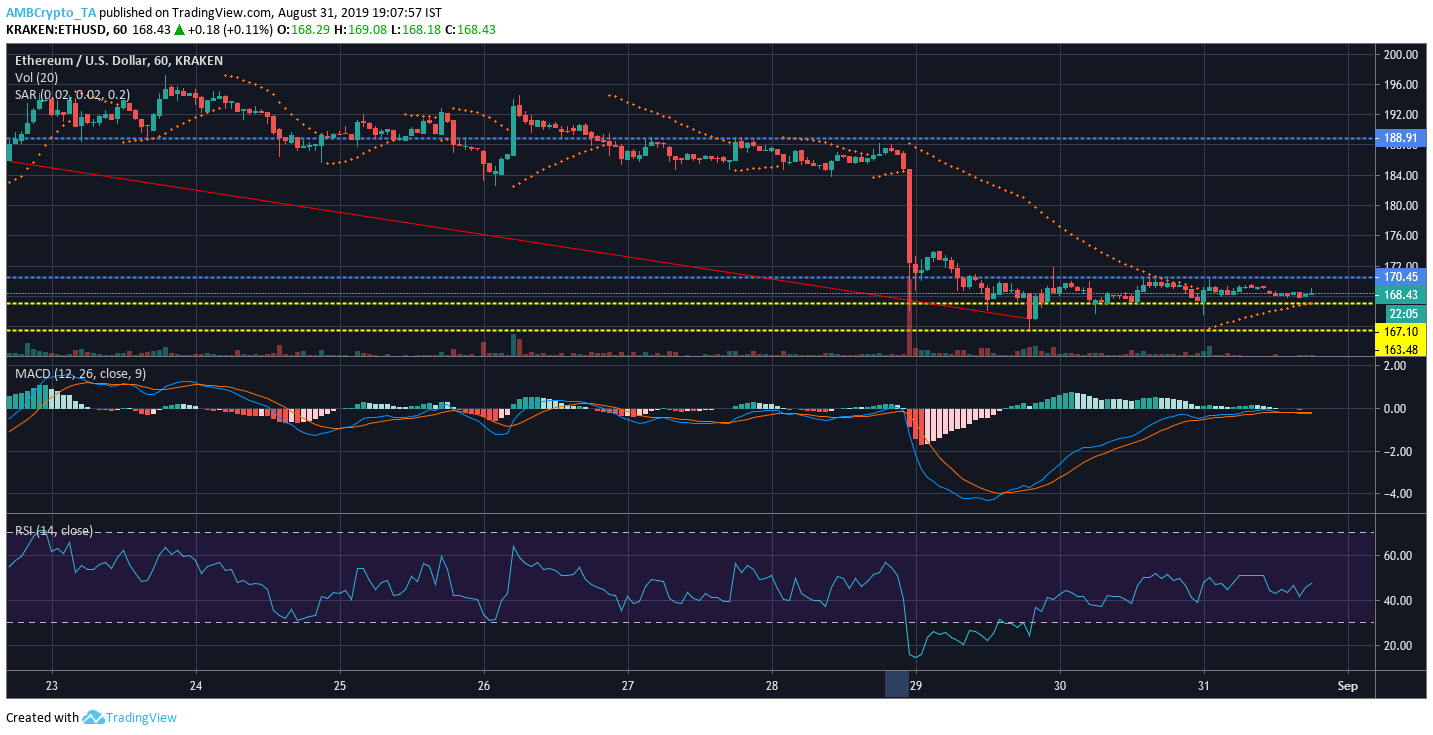
Source: Trading View
Resistance $188.91
Resistance 2: $170.45
Support 1: $167.10
Support 2: $163.48
The price fall on 29th August was fairly evident in the short term chart for Ethereum. A prominent downtrend was also witnessed which saw the price drop from $185.62 to $164.86.
The Parabolic SAR indicated bullish traits as the dotted markers remained below the candles.
The MACD line was below the signal line which suggested a bearish outbreak but the indicators remained at close proximity.
The Relative Strength Index or RSI remained neutral in the charts.
1-day chart
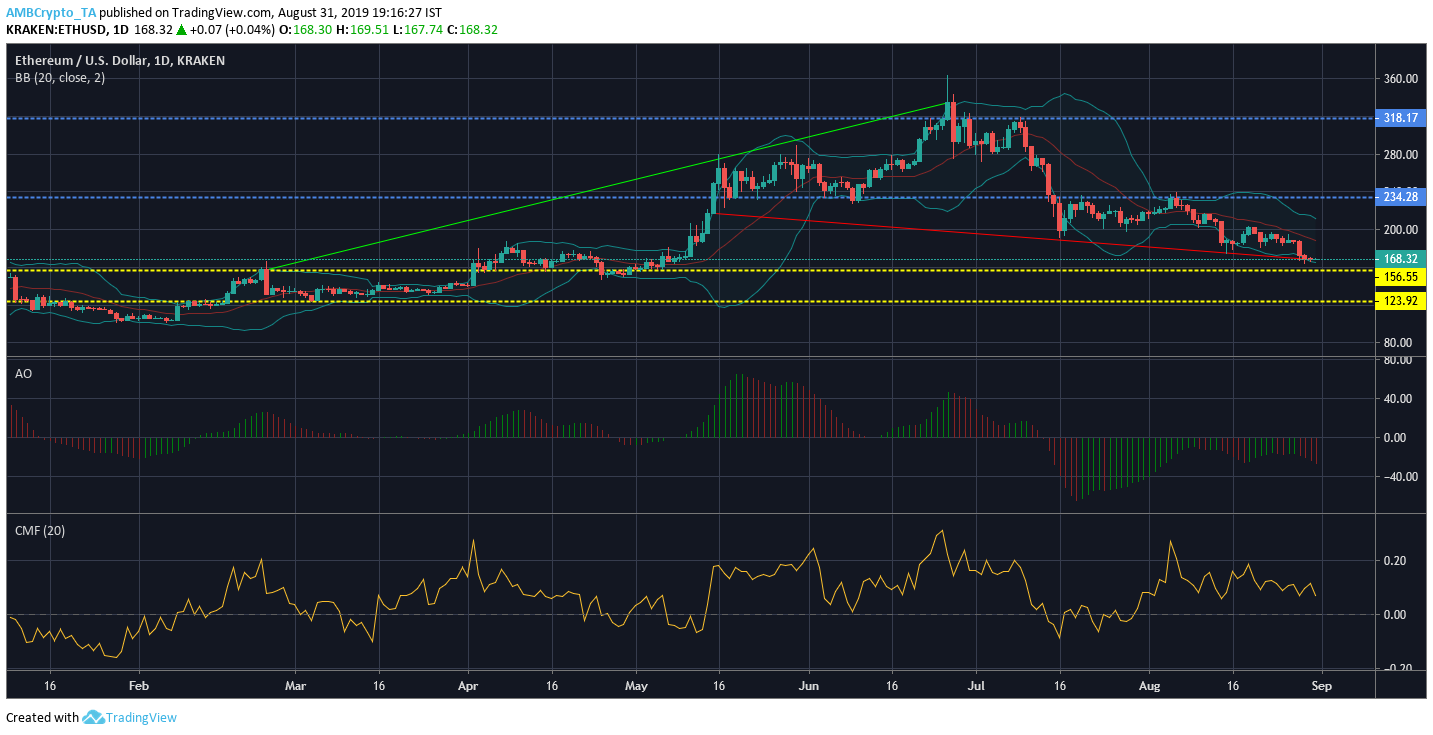
Source: Trading View
Resistance 1: $318.77
Resistance 2: $234.28
Support 1: $156.55
Support 2: $123.92
The long term chart was bullish but as the coin has progressively dipped over time. A massive uptrend was exhibited from $157.33 to $334.06, but the valuation slumped from 216.41 to 168.41.
The Bollinger Bands appeared to be diverging indicating a volatile phase in the future.
The Awesome Oscillator or AO had red bars appear at press time suggesting strong bearish momentum.
The Chaikin Money Flow or CMF line remained above the zero-line suggesting dominant the in-flow capital of the virtual asset.
Conclusion
The price continued to dip in the charts as the valuation of Ethereum continued to suffer in the presence of the bears.