
- Ethereum has been on the verge of surging past the $3.5k resistance level over the last five days
- Traders can anticipate a rally towards $3.9k, but chances of a bearish reversal thereafter would solidify
Ethereum [ETH], at the time of writing, was trading below the $3.5k-$3.6k resistance zone. Its momentum has stalled over the past week. In fact, a recent report revealed that the taker buy-sell ratio fell below 1 too.
This indicated a reduction in buying pressure in recent days.
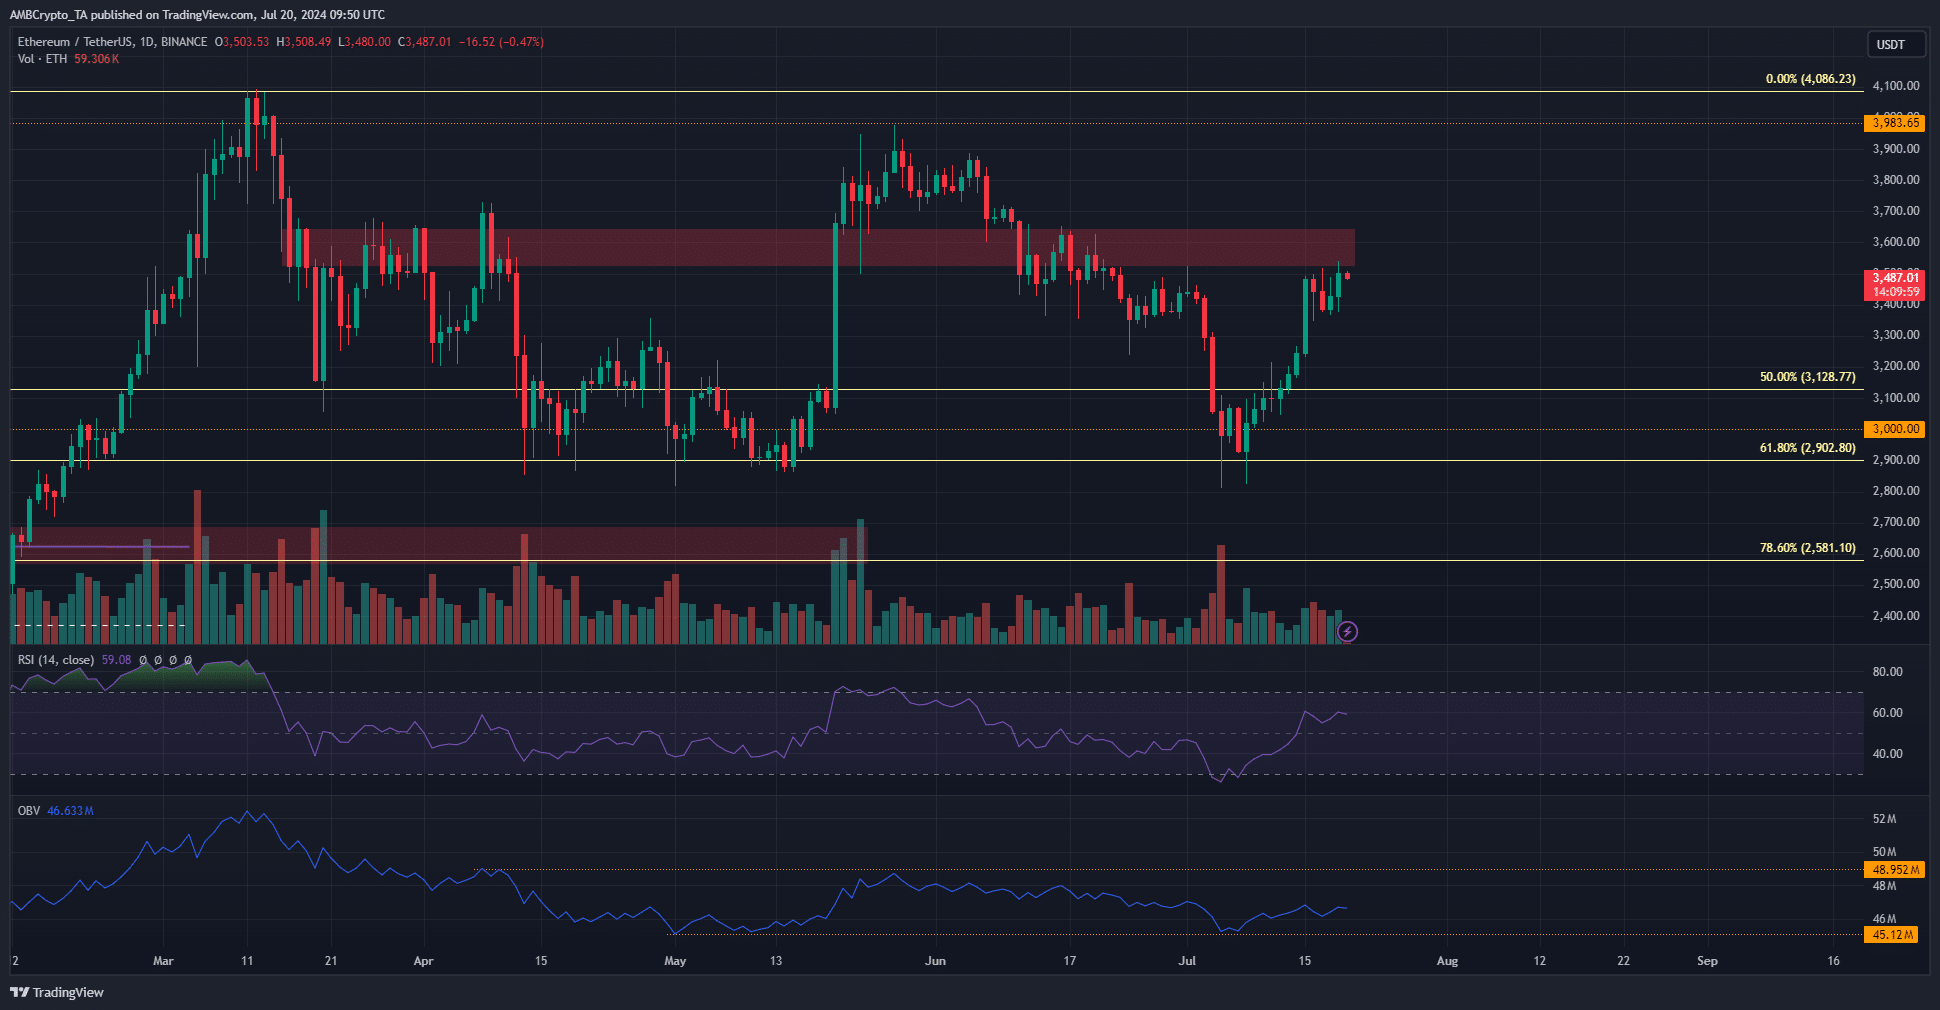
Source: ETH/USDT on TradingView
The daily RSI signaled bullish momentum, but the OBV was closer to the lows of a range from May. This was not a good sign for the bulls.
Hence, AMBCrypto investigated whether the on-chain metrics leaned bearishly or bullishly.
Recent positive netflows explain stalled momentum
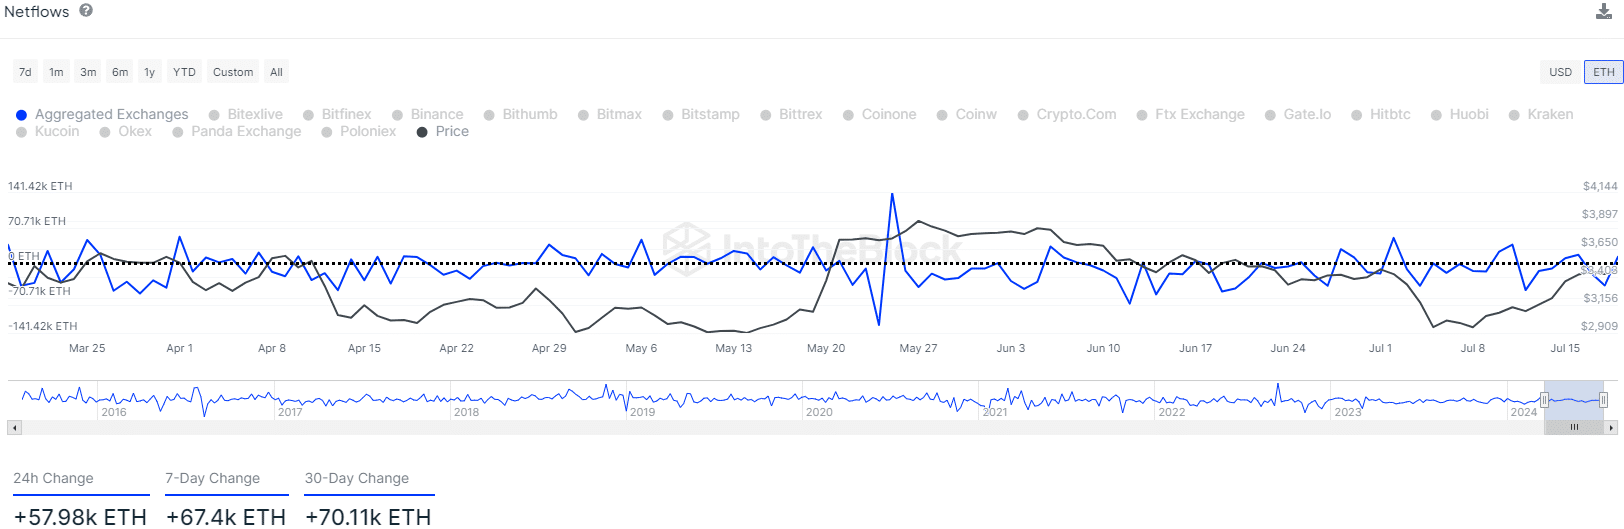
Source: IntoTheBlock
The exchange netflow data revealed that over the past week, 57.98k ETH flowed into exchanges. Over the past month, 70.11k ETH flowed in.
This meant more inflows than outflows, which in turn precipitated potentially greater selling pressure in the altcoin’s market.
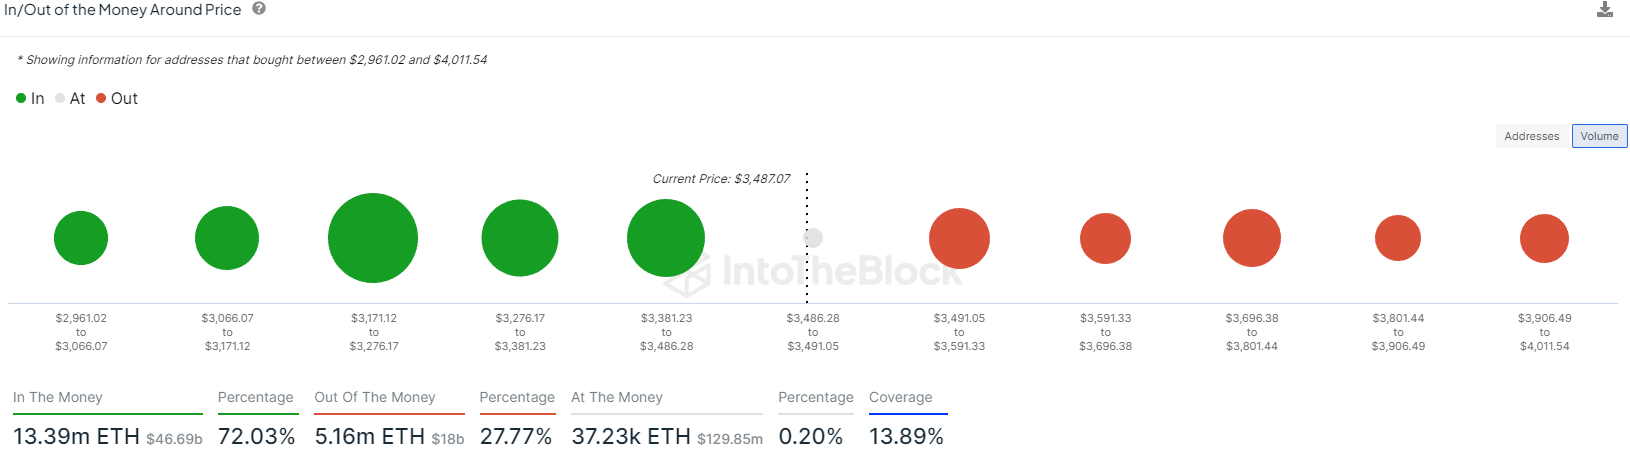
Source: IntoTheBlock
Additionally, the in/out of the money graph revealed that by volume, the $3171-$3276 zone was the strongest demand zone.
Meanwhile, the $3.5k and $3.7k resistance levels might pose as opposition to the market’s bulls.
On-chain metrics underline Ethereum’s stagnancy
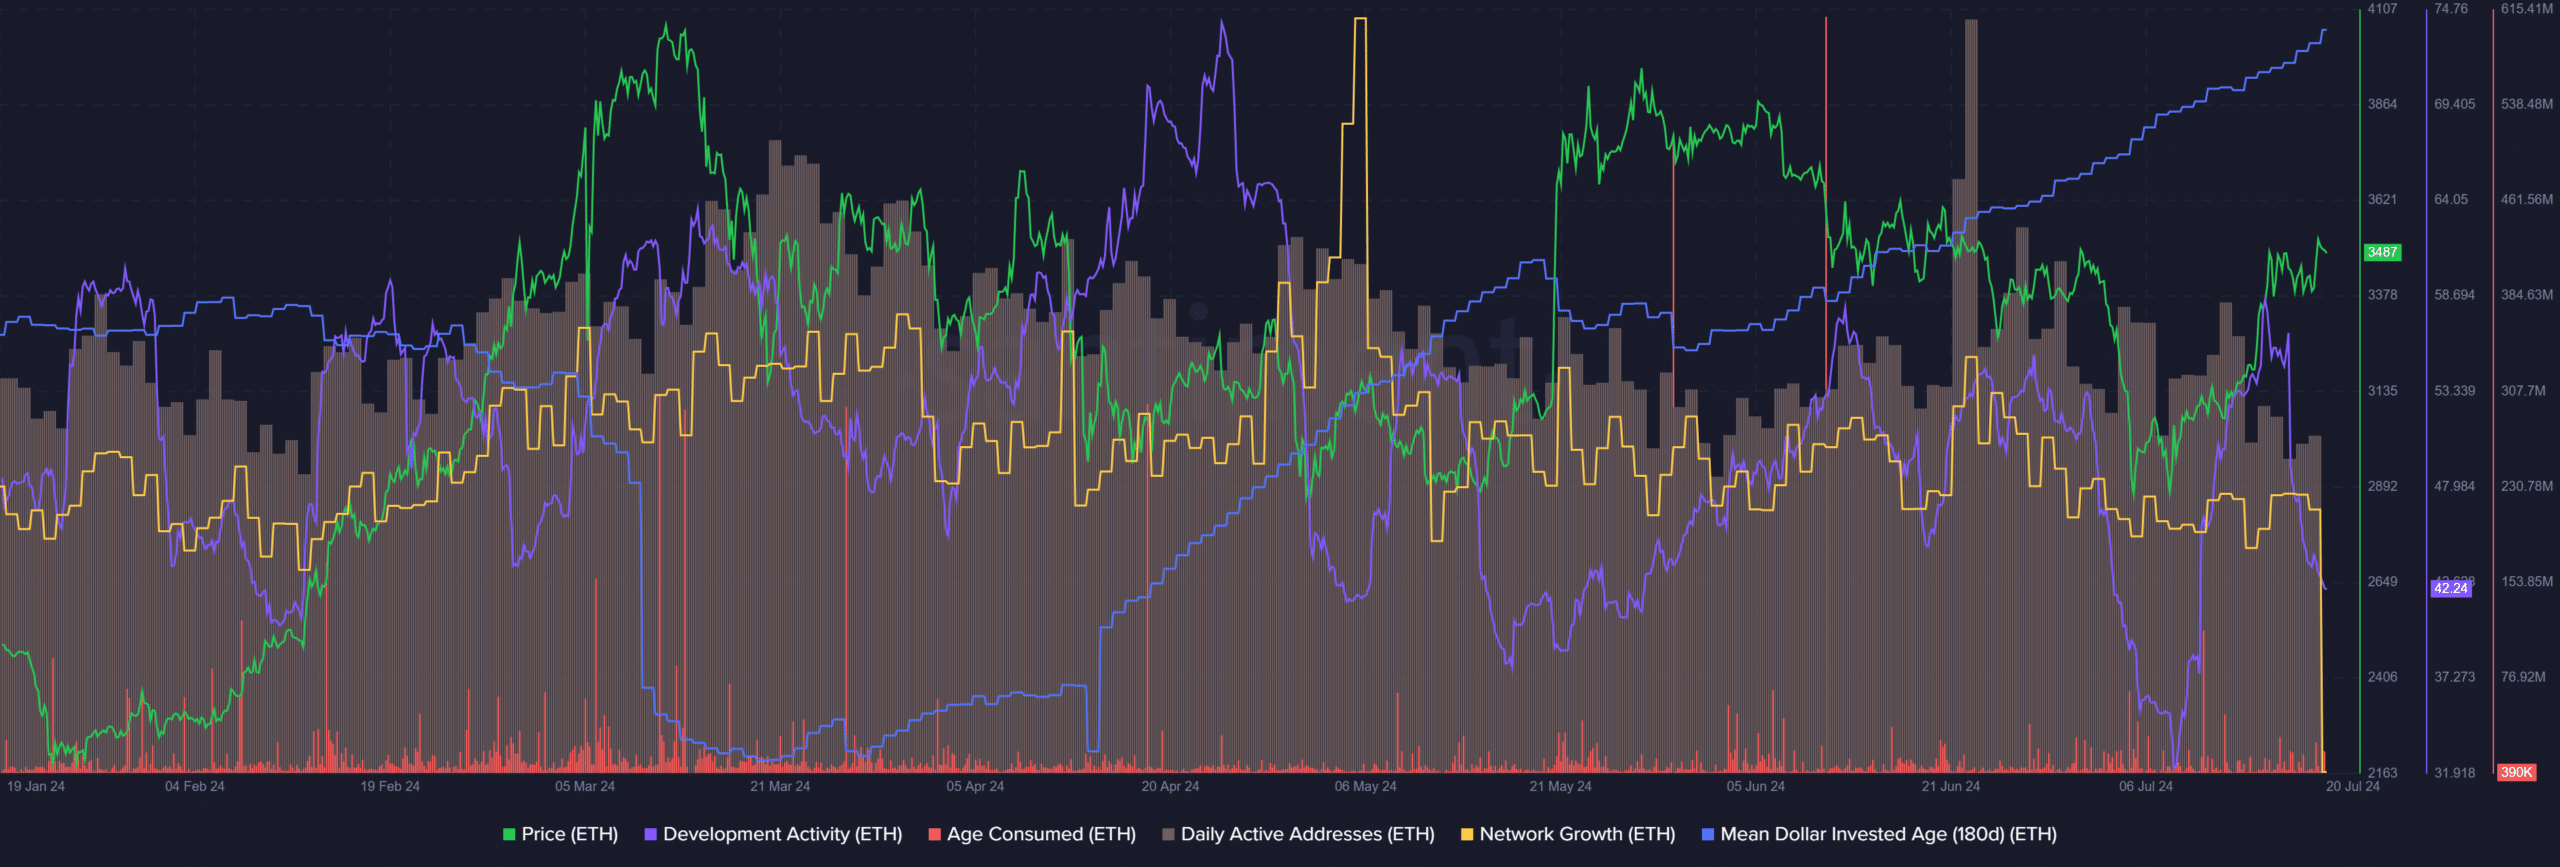
Source: Santiment
The 180-day mean dollar invested age (MDIA) metric has been trending higher since April. A prolonged uptrend is not welcome as it indicates reduced network activity and investments getting stagnant.
On the other hand, the development activity has been robust regardless of ETH’s price trend, which long-term investors would appreciate.
The daily active addresses and network growth saw a spike on 22 June, but both metrics have receded since. The age-consumed metric has also been quiet over the past week.
Overall, the metrics showed that Ethereum would have a tough time climbing past the $3.6k-$3.7k resistance.
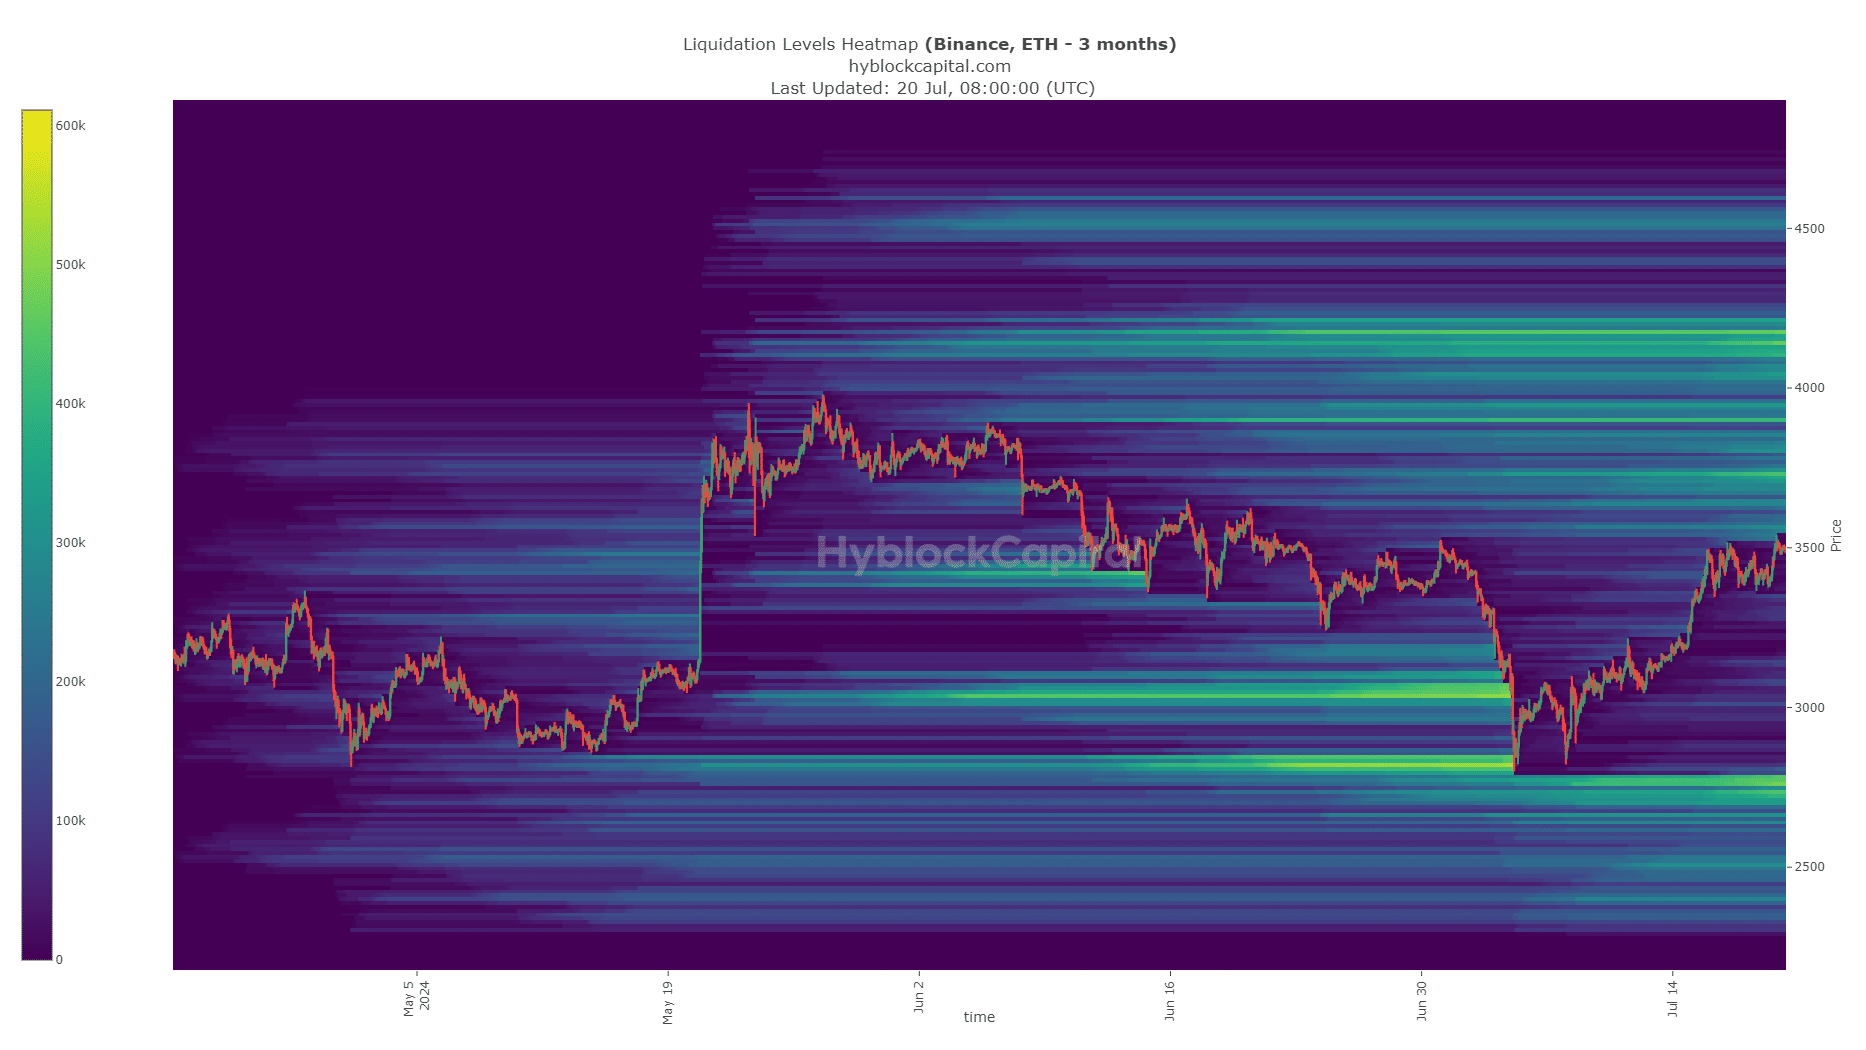
Source: Hyblock
Read Ethereum’s [ETH] Price Prediction 2024-25
This point was reinforced by AMBCrypto’s analysis of the liquidation heatmap. After sweeping the pool of liquidity at $2.8k, Ethereum has rebounded healthily. Two liquidity clusters at $3.7k and $3.9k loomed ahead.
It could attract prices to them and reverse the trend, just as investors get excited about the potential for Ethereum to break the $4k resistance level.