Etheruem’s next price target: ETH can cross $3700, IF…
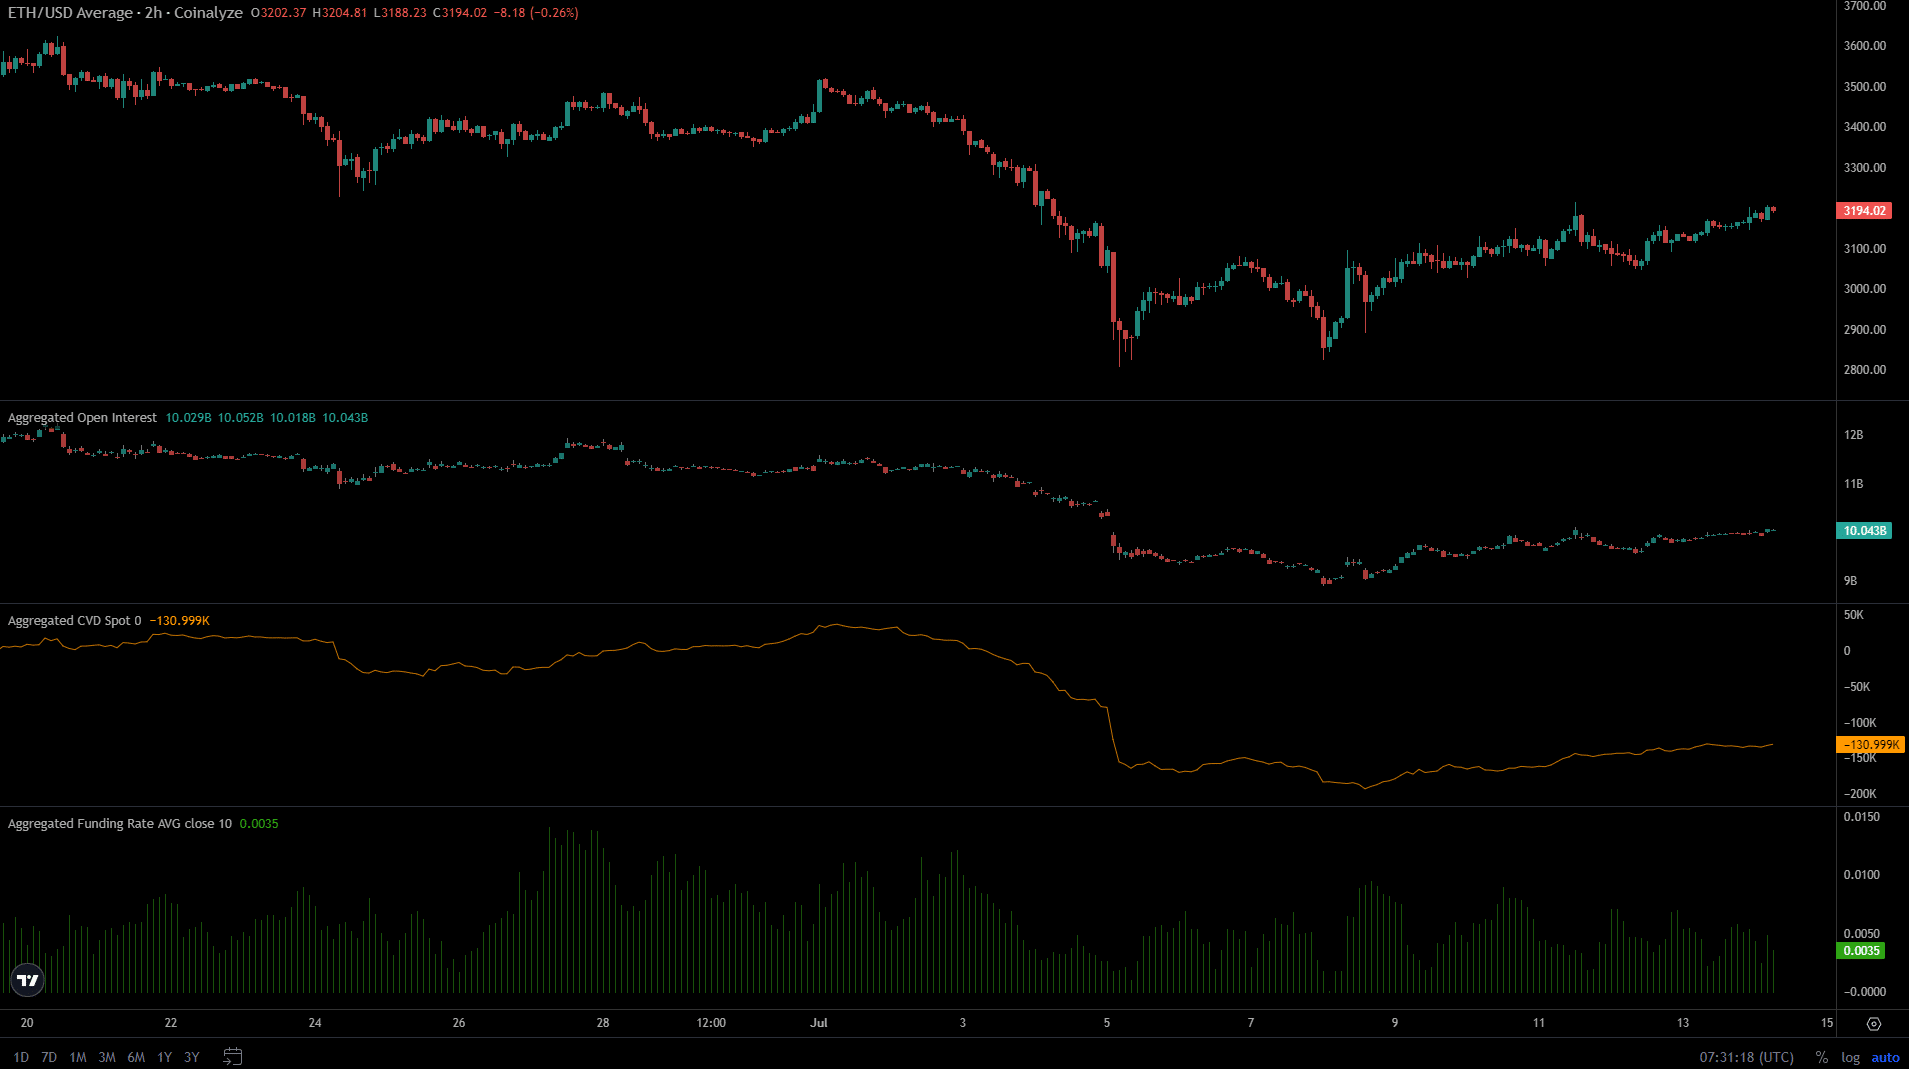
The Open Interest has climbed alongside the prices and the funding rate was positive. ETH could rise above $3,600 if the trend sustains.

- Ethereum has a bearish market structure on the daily chart but still targets the next key resistance zone.
- The volume has been sub-par in recent days, hence a retracement next week is possible.
Ethereum [ETH] clambered back above the $3k level, and in an interesting turn of events for the bulls, the $3.1k former resistance zone was flipped to support.
The balancing act between whale deposits and exchange reserves showed that the recent deposits were minor compared to the outflows of the past two months.
The Ethereum network’s gas fee reached May’s lows, a sign of reduced network activity. This was not a positive sign and reflected reduced on-chain demand and slow growth.
Volume indicators ambivalent despite the breakout
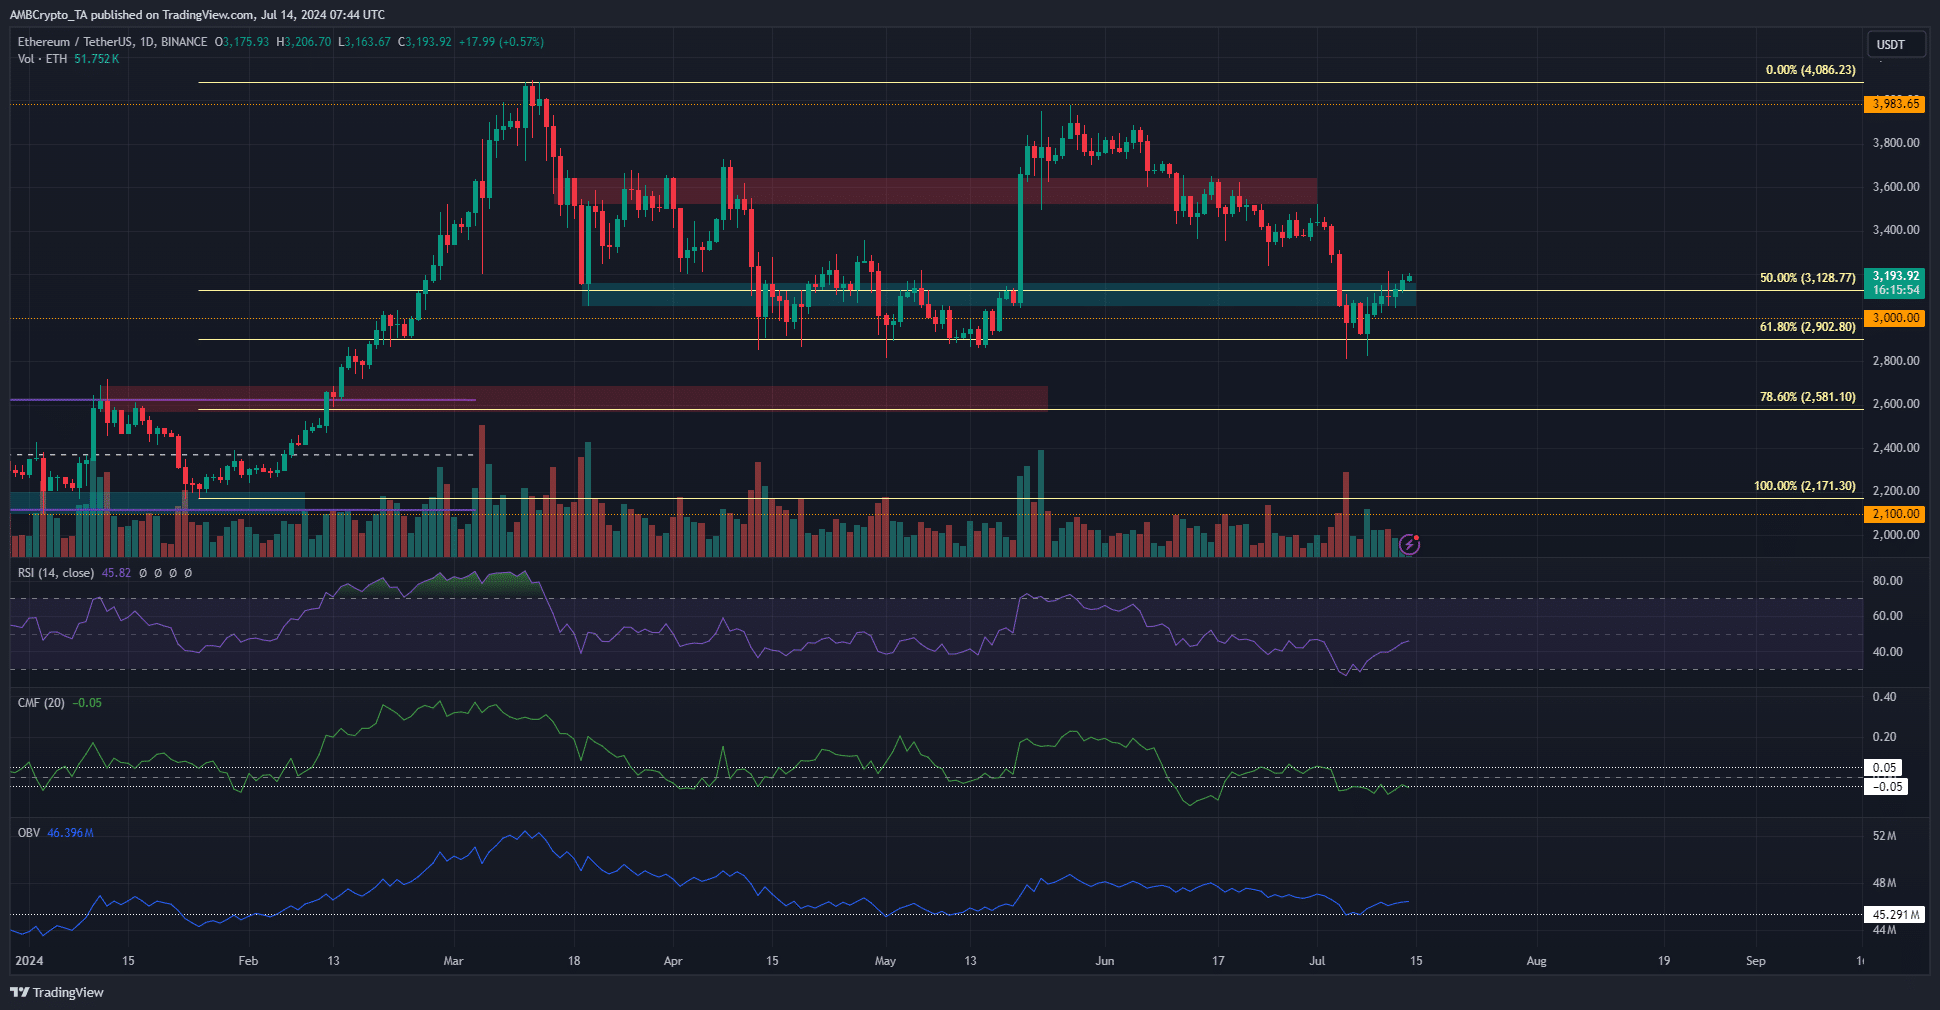
On Saturday the 13th of July, Ethereum closed a daily trading session at $3,201, breaking out of the resistance zone in the $3.1k area. Despite this achievement, the market structure and momentum were bearish in the daily timeframe.
Moreover, the CMF showed a reading of -0.05 which signaled notable capital flow out of the market. The OBV was unable to start an uptrend as buying volume stuttered over the past ten days. This meant that the volume was too weak to be taken as a clear signal of bullish strength.
The daily RSI was at 45 to signal bearish momentum but has crept higher over the past week. As things stand, Ethereum might not be ready for a swift upward move unless more volume enters the market.
Liquidation heatmap’s clues on the next resistance
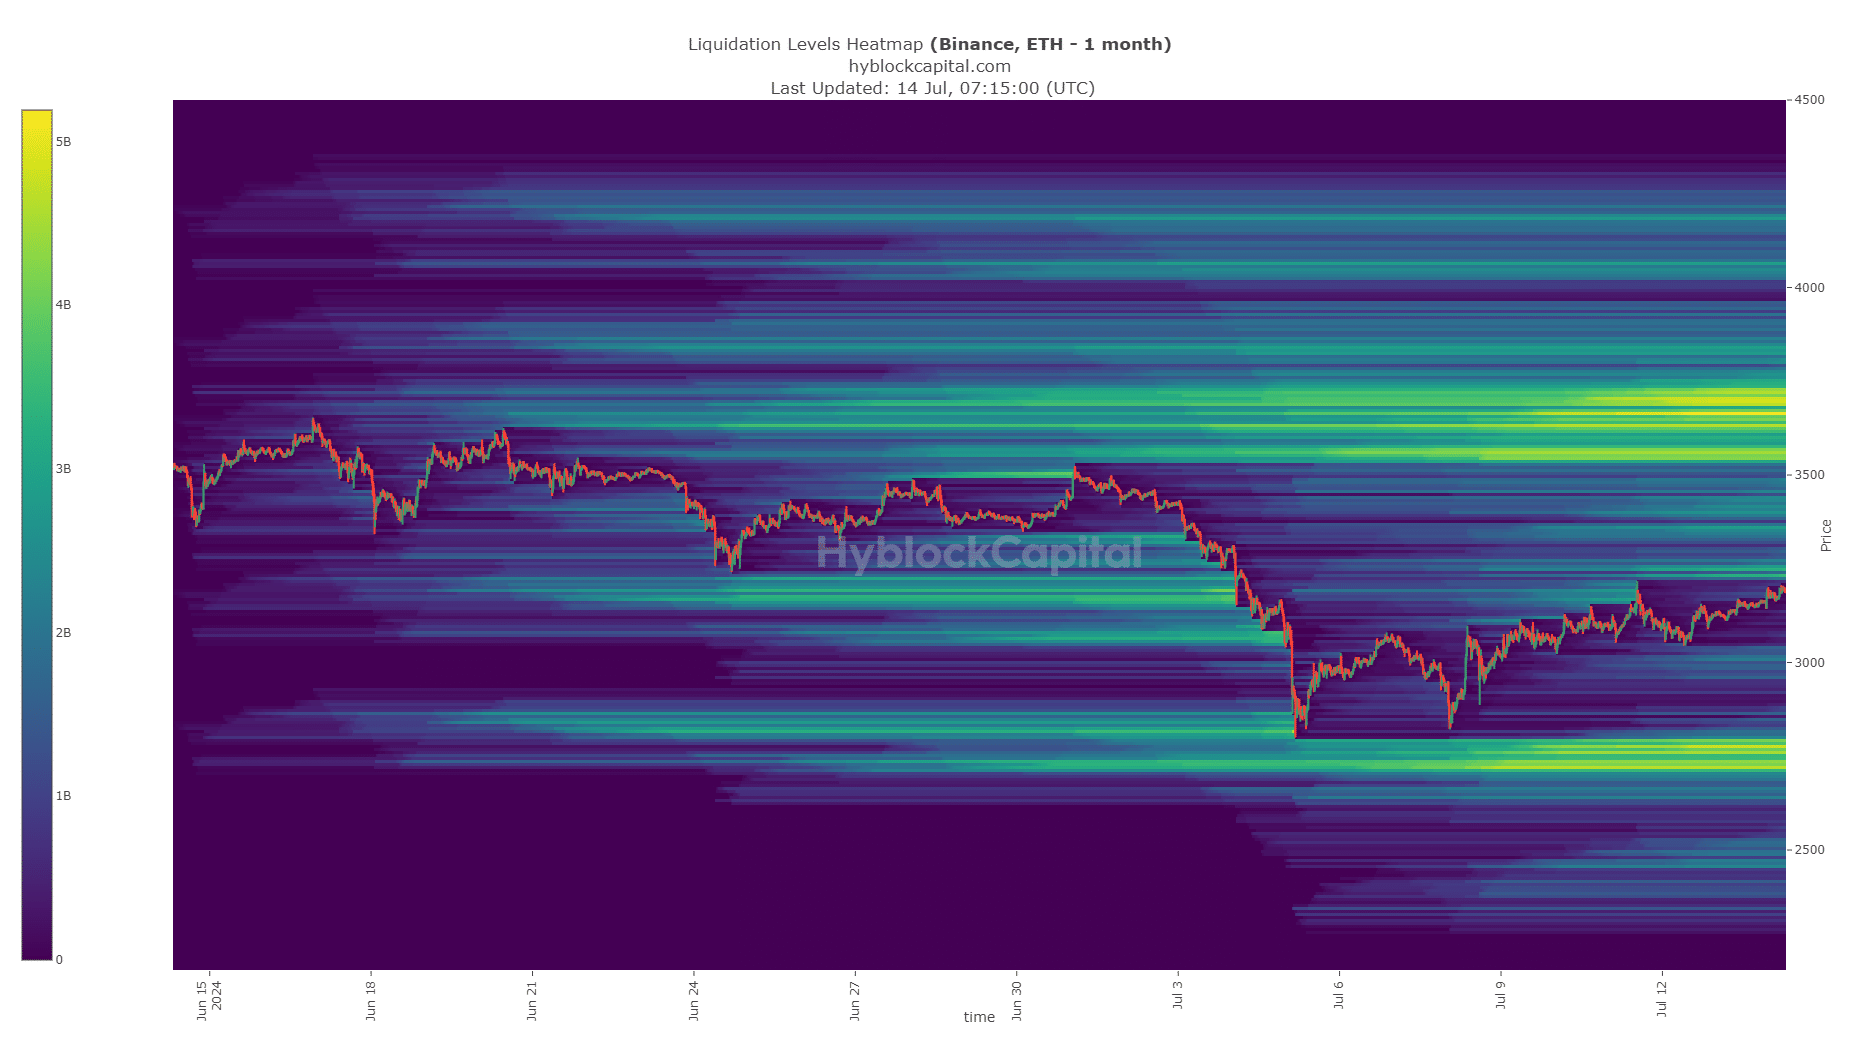
The $2.7k-$2.8k zone to the south was an attractive pool of liquidity. It was tested in the first week of July but not wholly swept.
The subsequent price bounce above $3.1k meant the next liquidity cluster at $3.5k-$3.7k would be the target for bulls.
Is your portfolio green? Check the Ethereum Profit Calculator
The Open Interest has climbed alongside the prices and the funding rate was positive. The sentiment was strongly bullish, and the spot CVD was recovering too.
If the trend remained intact, the chances of an ETH move toward $3.6k would become healthier.
Disclaimer: The information presented does not constitute financial, investment, trading, or other types of advice and is solely the writer’s opinion.


