
Ethereum smashes local highs in Japan, Korea – Is a move to $4,500 next?

- BONK may hit the $0.00004-level if it closes strongly above the $0.000028-level
- Investors seem to be showing more interest in WIF, compared to BONK
Following the latest update associated with Spot Ethereum exchange-traded funds (ETFs) the crypto market turned green. In the middle of this market recovery, Solana-based Bonk (BONK) flipped dogwifhat (WIF) on the charts and became the world’s fourth-largest memecoin.
12% hike fuels flip
According to CoinMarketCap, BONK appreciated by over 12% in the last 7 days, with WIF losing 16% of its value over the same period. Thanks to the same, BONK’s market cap hit $1.83 billion while WIF’s fell to $1.69 billion.
Here, it’s worth pointing out though that at press time, BONK was struggling to sustain its bullish momentum. This corresponded with the fact that the memecoin’s trading volume fell by over 45% too – A sign of investors and traders’ lower participation.
That’s not all either, since its Open Interest also dropped by 14.3% due to bearish market sentiment and selling pressure across the market.
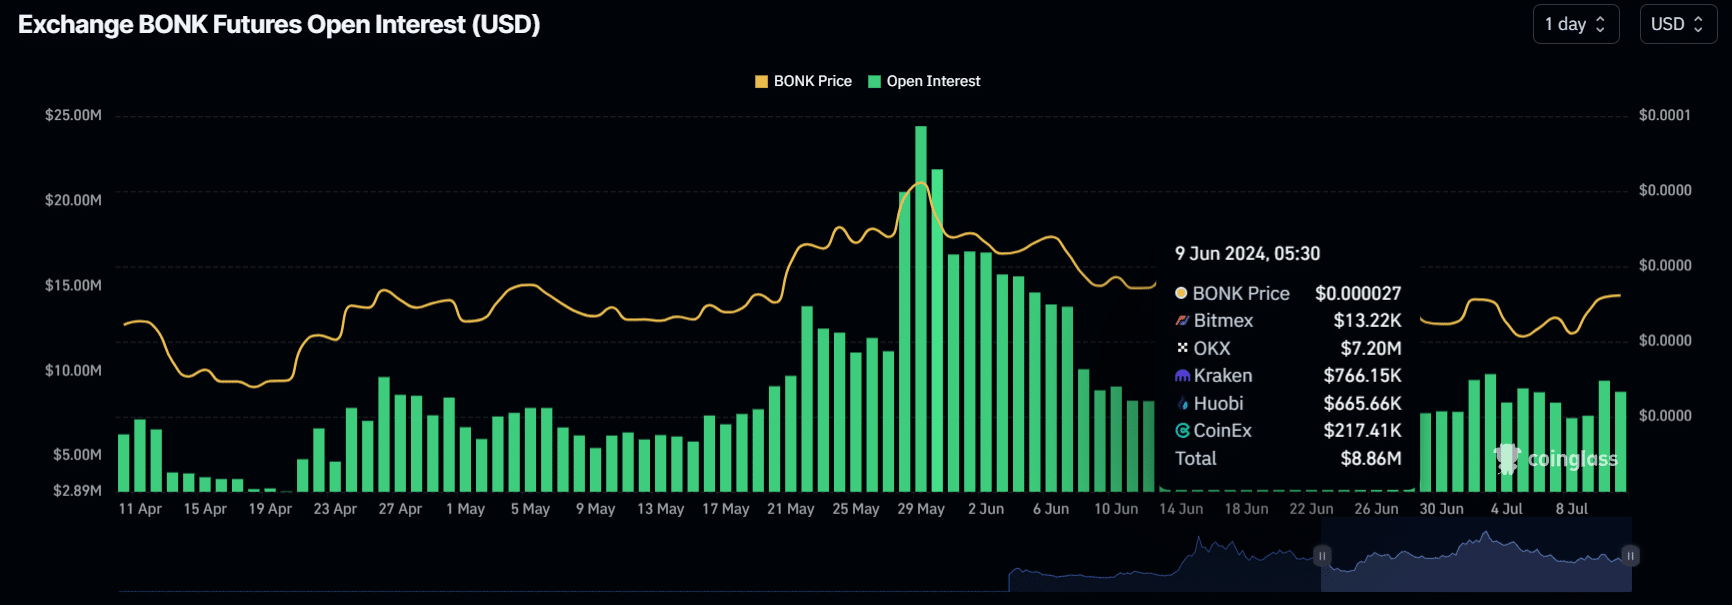
Source: Coinglass
WIF, trading near $1.65 at the time of writing, was struggling on the same fronts too. Its trading volume dropped by over 38% as well. On the contrary though, its OI hiked by over 4% in the last 24 hours.
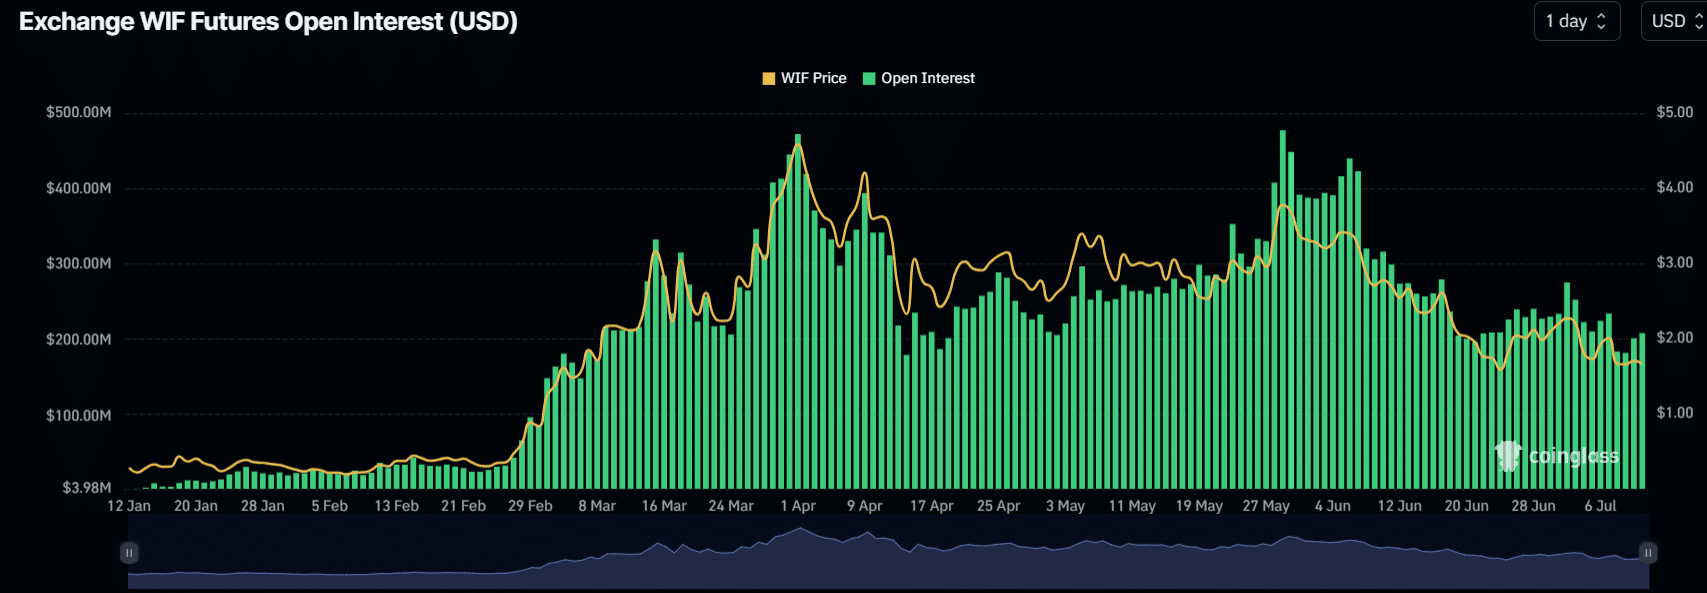
Source: Coinglass
Technical analysis and key levels
On the price charts, BONK appeared to be on an uptrend and looked bullish. Since December 2023, BONK has consistently received support from a trendline, leading to significant surges. This time, after taking support, it surged by more than 27% in just 3 days.
Meanwhile, BONK has now hit its strong resistance area near $0.000026. This level is the neckline of a bullish double-bottom price action pattern. If it flashes a breakout and the daily candle closes above the $0.000028-level, then there is a high possibility that it will hit the $0.000040-level – Its next resistance level.
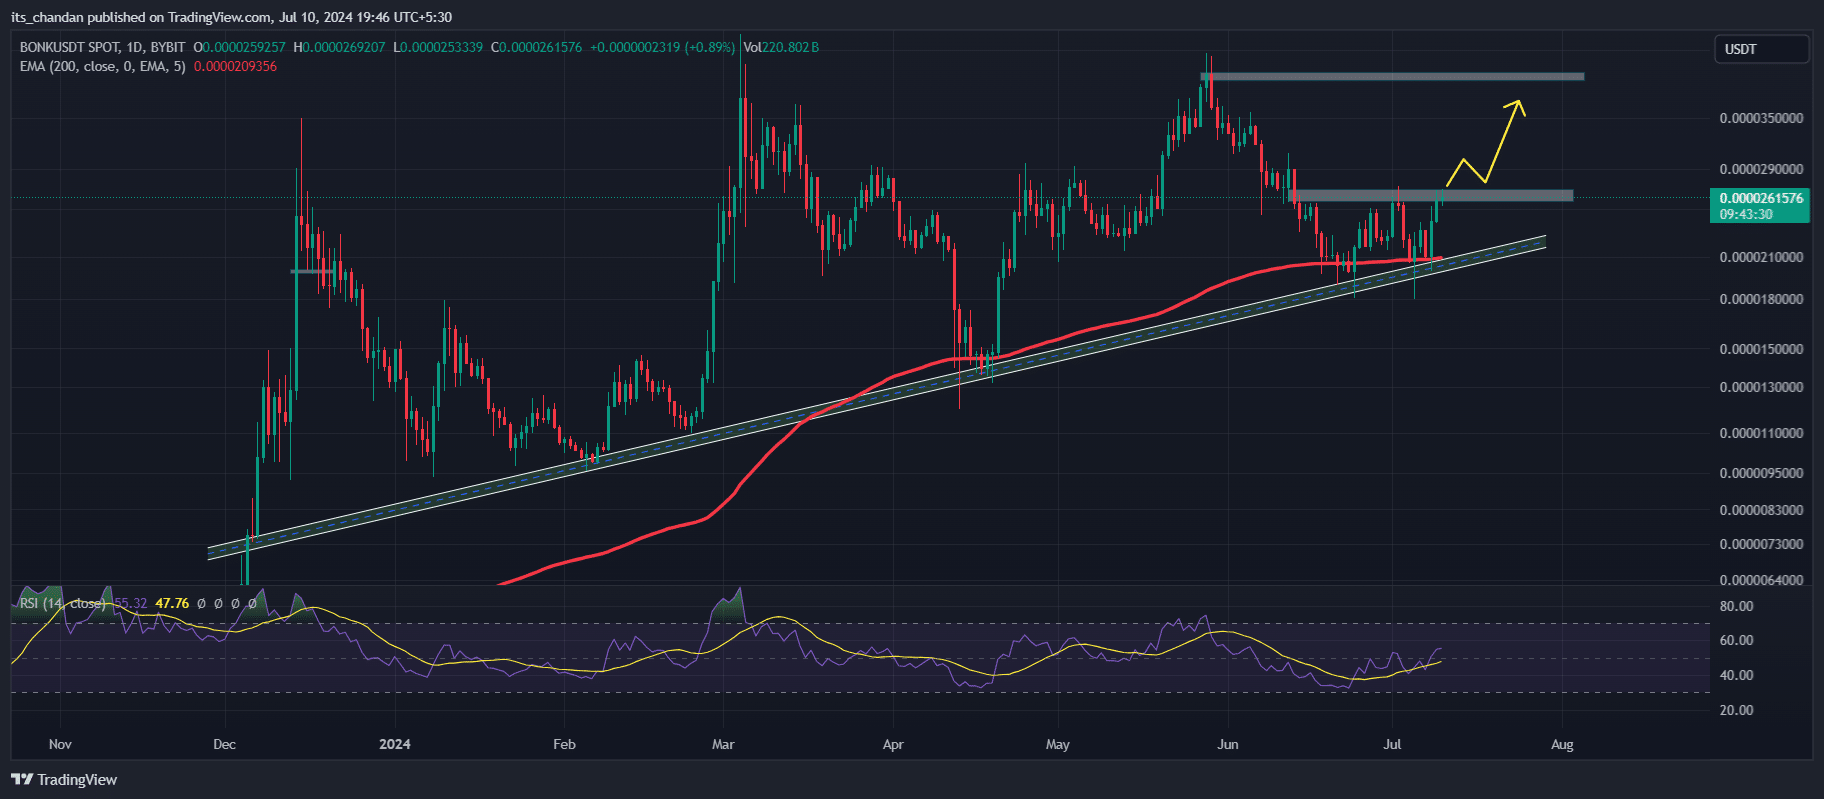
Source: BONK/USD, TradingView
Besides this analysis, technical indicators suggested that BONK is in a bull cycle as it seemed to be moving above the 200 Exponential Moving Average (EMA).


