Examining how Solana-based BONK ‘flipped’ WIF after 12% hike
A flippening on the memecoin front could have major consequences.

- BONK may hit the $0.00004-level if it closes strongly above the $0.000028-level
- Investors seem to be showing more interest in WIF, compared to BONK
Following the latest update associated with Spot Ethereum exchange-traded funds (ETFs) the crypto market turned green. In the middle of this market recovery, Solana-based Bonk (BONK) flipped dogwifhat (WIF) on the charts and became the world’s fourth-largest memecoin.
12% hike fuels flip
According to CoinMarketCap, BONK appreciated by over 12% in the last 7 days, with WIF losing 16% of its value over the same period. Thanks to the same, BONK’s market cap hit $1.83 billion while WIF’s fell to $1.69 billion.
Here, it’s worth pointing out though that at press time, BONK was struggling to sustain its bullish momentum. This corresponded with the fact that the memecoin’s trading volume fell by over 45% too – A sign of investors and traders’ lower participation.
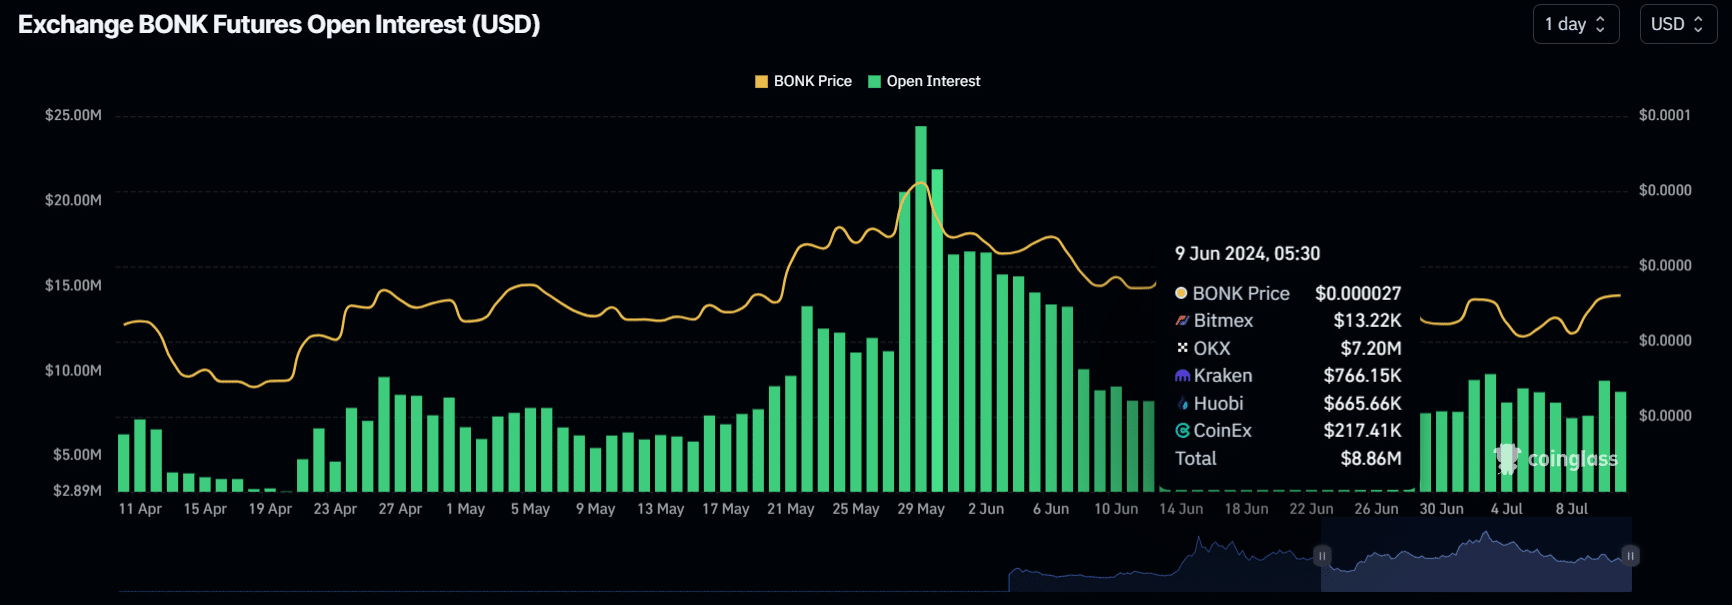
That’s not all either, since its Open Interest also dropped by 14.3% due to bearish market sentiment and selling pressure across the market.
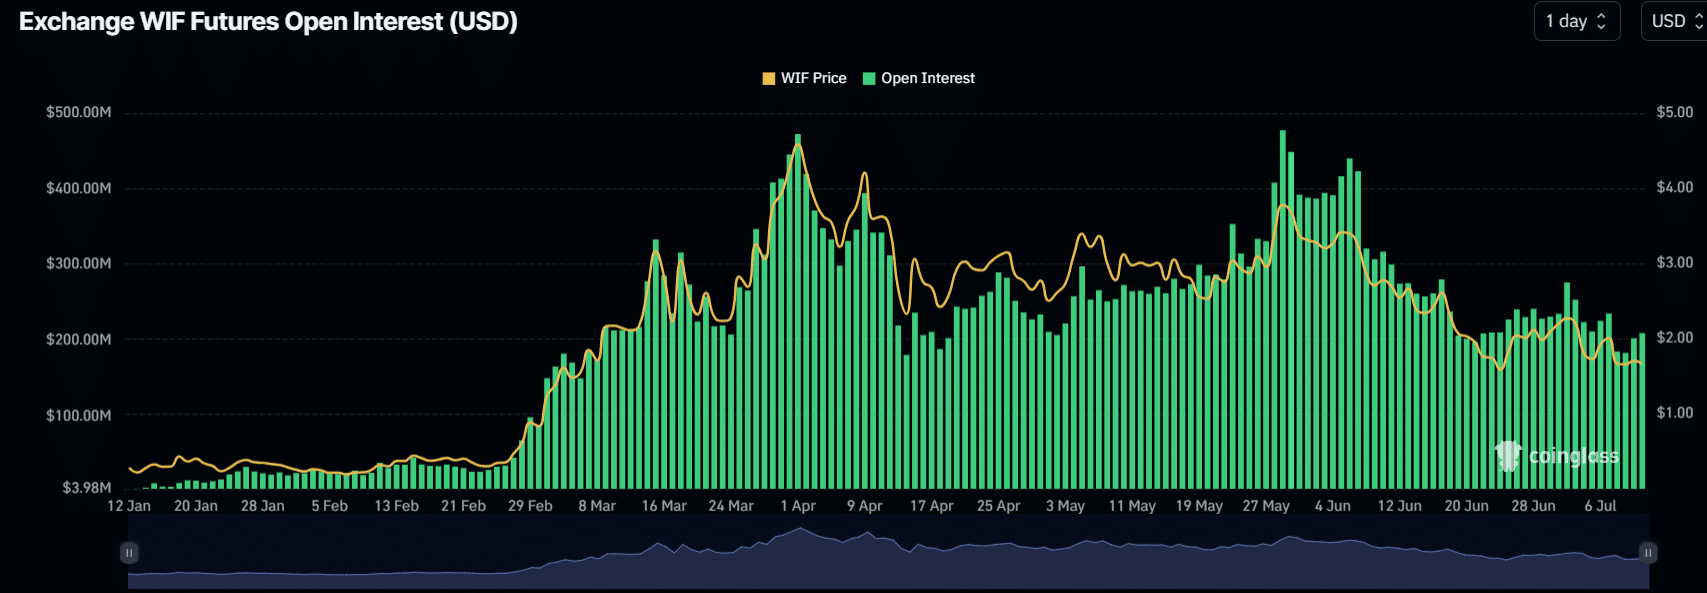
WIF, trading near $1.65 at the time of writing, was struggling on the same fronts too. Its trading volume dropped by over 38% as well. On the contrary though, its OI hiked by over 4% in the last 24 hours.
Technical analysis and key levels
On the price charts, BONK appeared to be on an uptrend and looked bullish. Since December 2023, BONK has consistently received support from a trendline, leading to significant surges. This time, after taking support, it surged by more than 27% in just 3 days.
Meanwhile, BONK has now hit its strong resistance area near $0.000026. This level is the neckline of a bullish double-bottom price action pattern. If it flashes a breakout and the daily candle closes above the $0.000028-level, then there is a high possibility that it will hit the $0.000040-level – Its next resistance level.
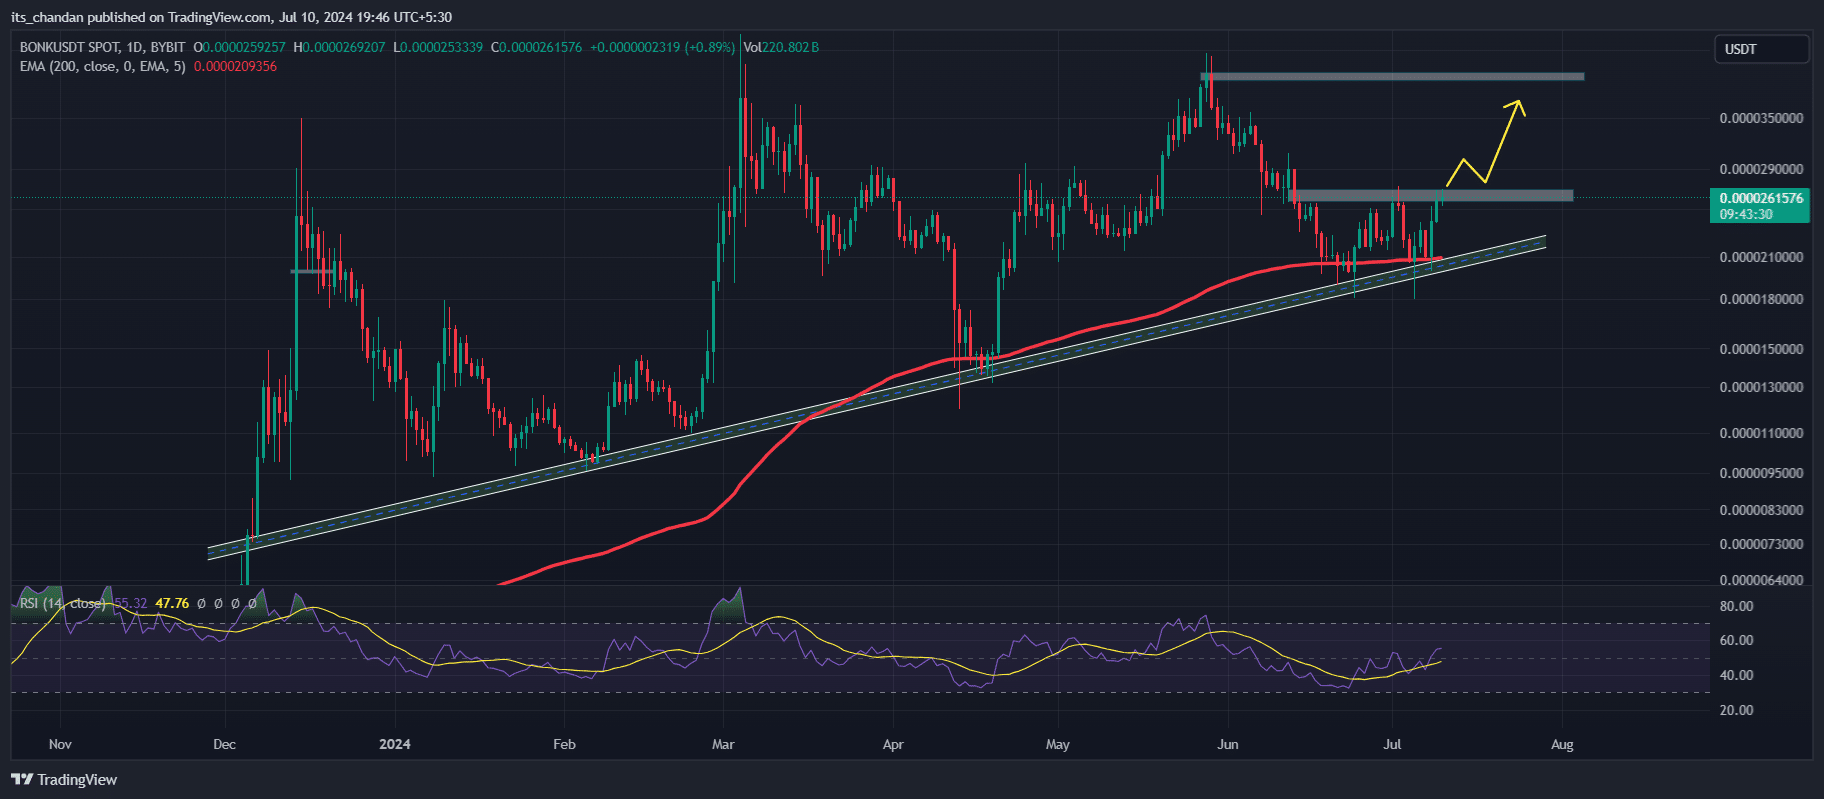
Besides this analysis, technical indicators suggested that BONK is in a bull cycle as it seemed to be moving above the 200 Exponential Moving Average (EMA).