


The crypto market has suffered a sizeable sell-off in recent hours. Since reaching a high of $65,622 on Monday, June 22, Bitcoin [BTC] has fallen by 3.55% to $62,466. The altcoin market cap has also shrunk 3.85% since Monday’s high.
Since the final week of May, Worldcoin [WLD] has seen a short-term uptrend. Last week, the altcoin reached a high of $0.723 on Wednesday, June 17. Since then, it has fallen by 22.17%, and the past 24 hours of trading alone saw WLD shed 11.5%.
The Open Interest has decreased by 16.05% in 24 hours, according to Coinalyze data. The swift price losses and declining speculative interest underlined the short-term bearish pressure on Worldcoin.
Assessing the hopeful Worldcoin price structure
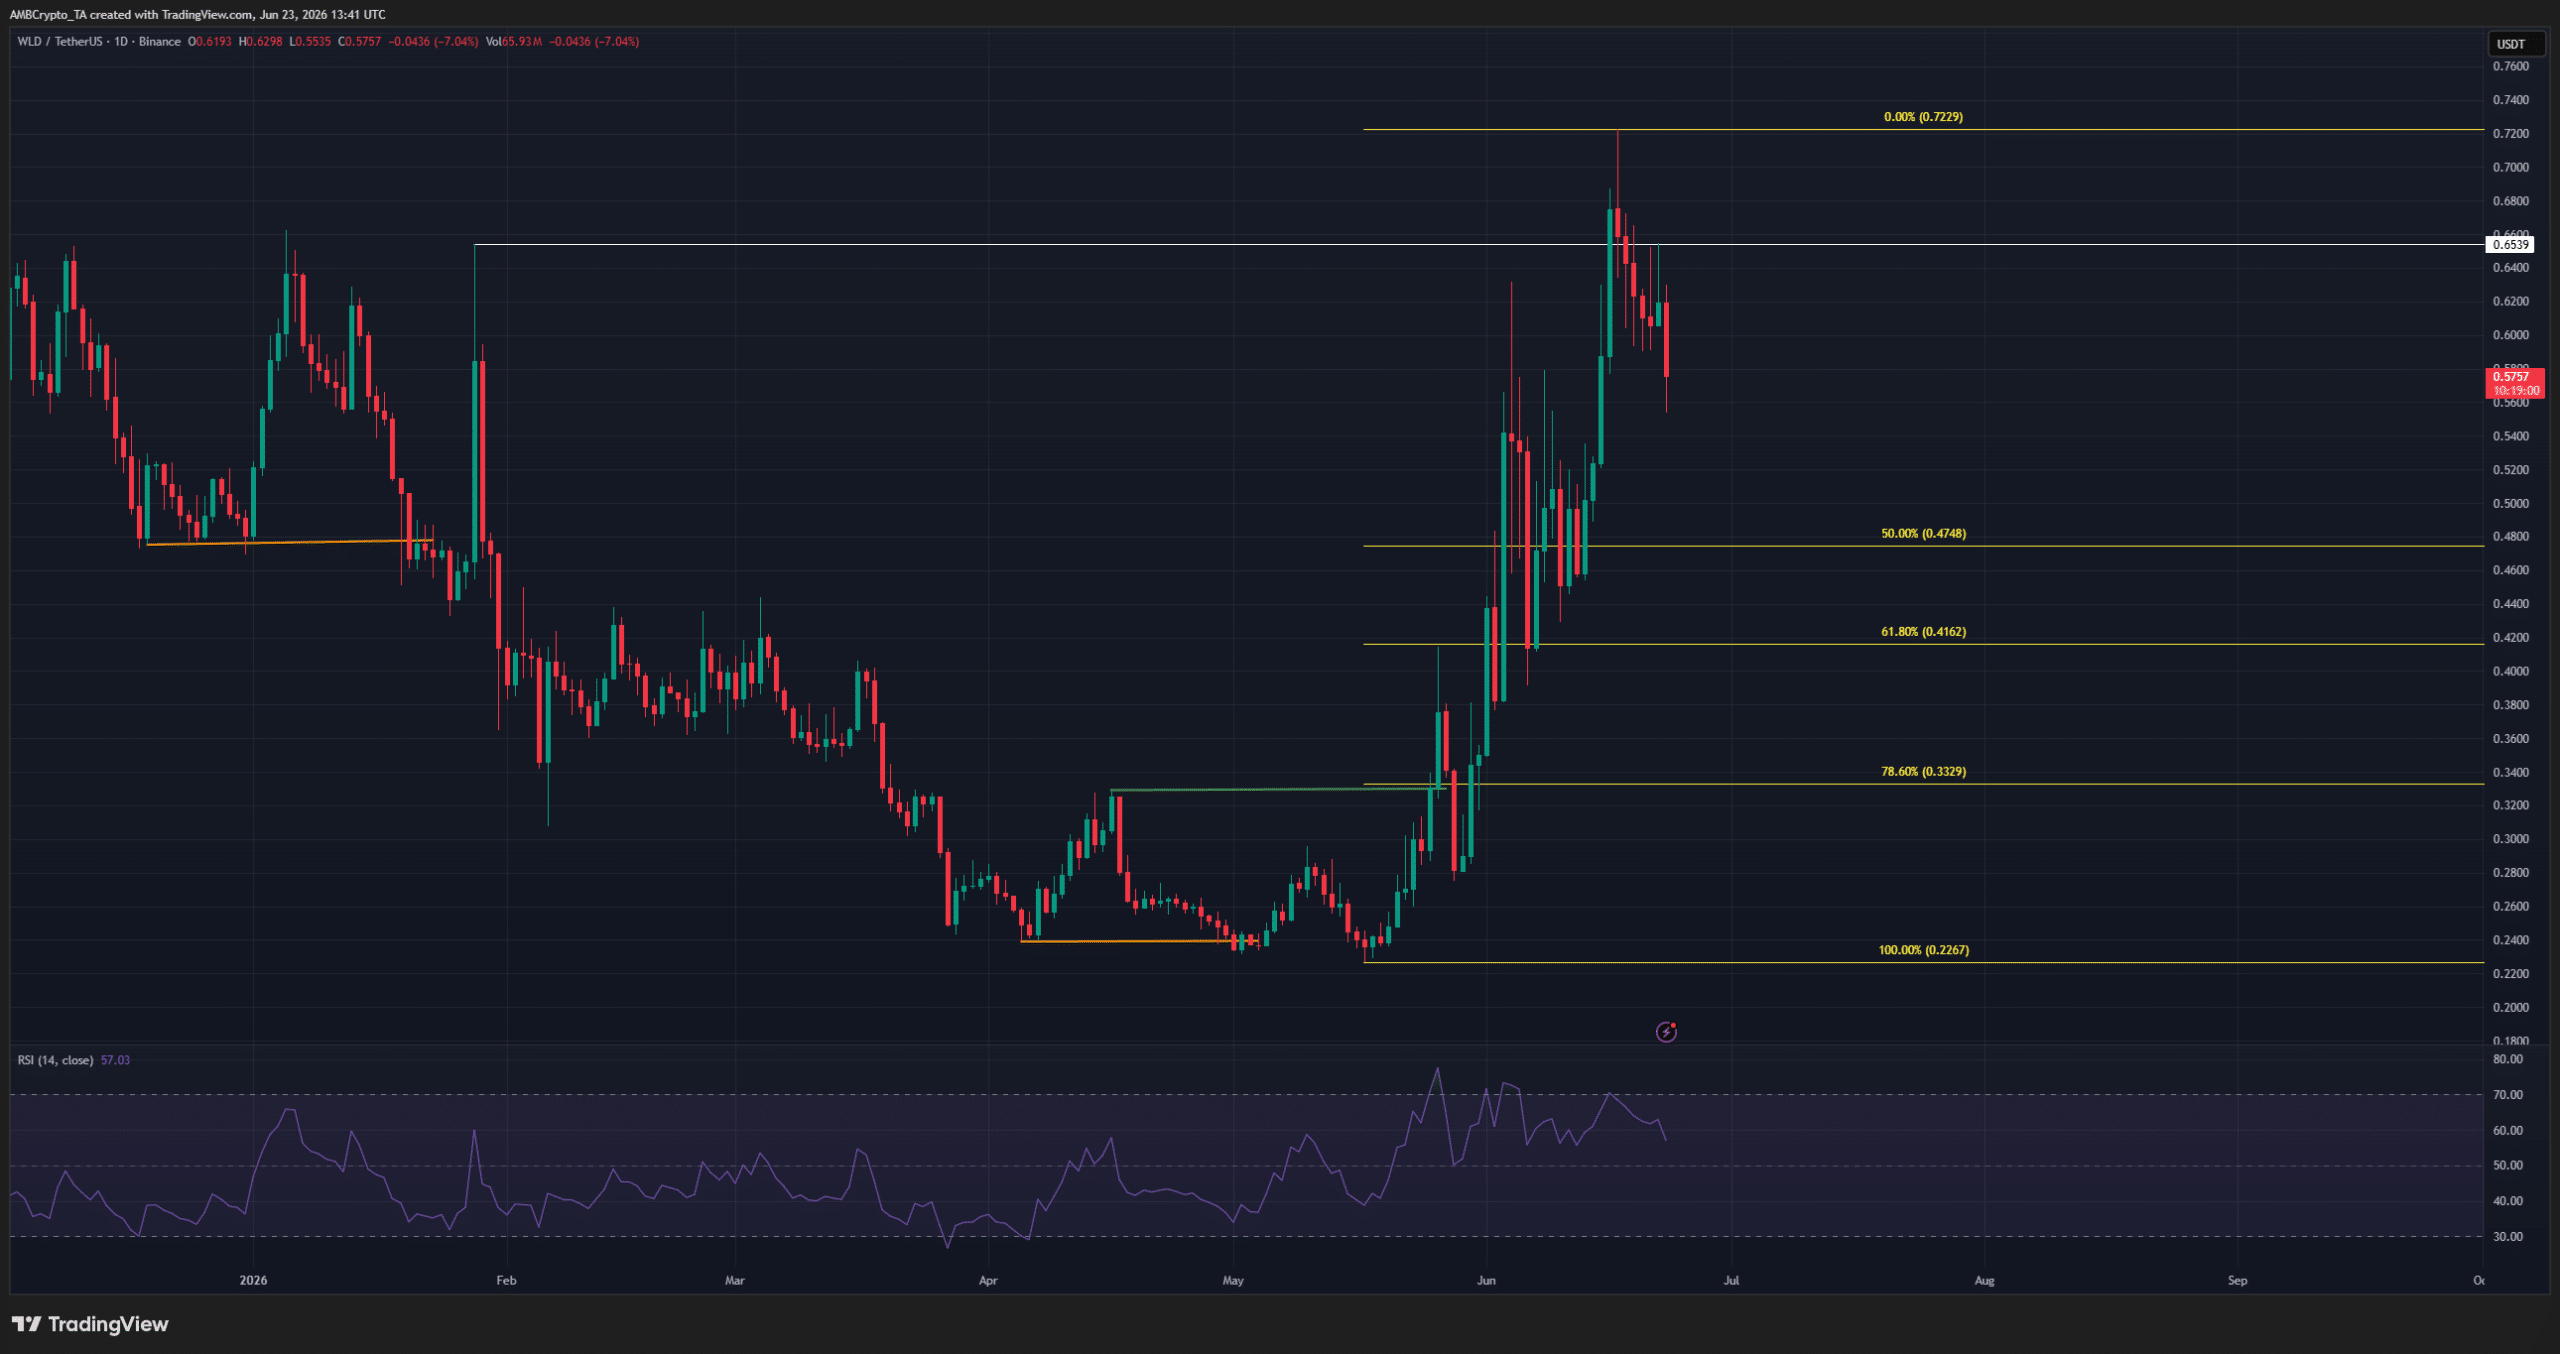
Despite the falling prices in recent days, WLD has made significant progress over the past month. The token made a bullish internal shift towards the end of May, when its prices surpassed a local high at $0.329 [green]. Since then, WLD has rallied swiftly and managed to surpass the $0.654 high made in February.
The daily session closed above this high from February marked a bullish swing structure shift on this timeframe. In this context, the losses of the past week were part of a retracement phase. Based on the swing move from $0.2267 to $0.7229, a set of Fibonacci retracement levels [yellow] was plotted.
The $0.4748, $0.4162, and $0.3329 levels are particularly important supports. Worldcoin bulls might be able to bring about a bullish reaction after a retest of one of these levels.
Swing traders and investors must remember that the Bitcoin long-term trend was bearish. A severe BTC sell-off could spark a deep WLD retracement in the coming months.
WLD traders might get another chance to buy
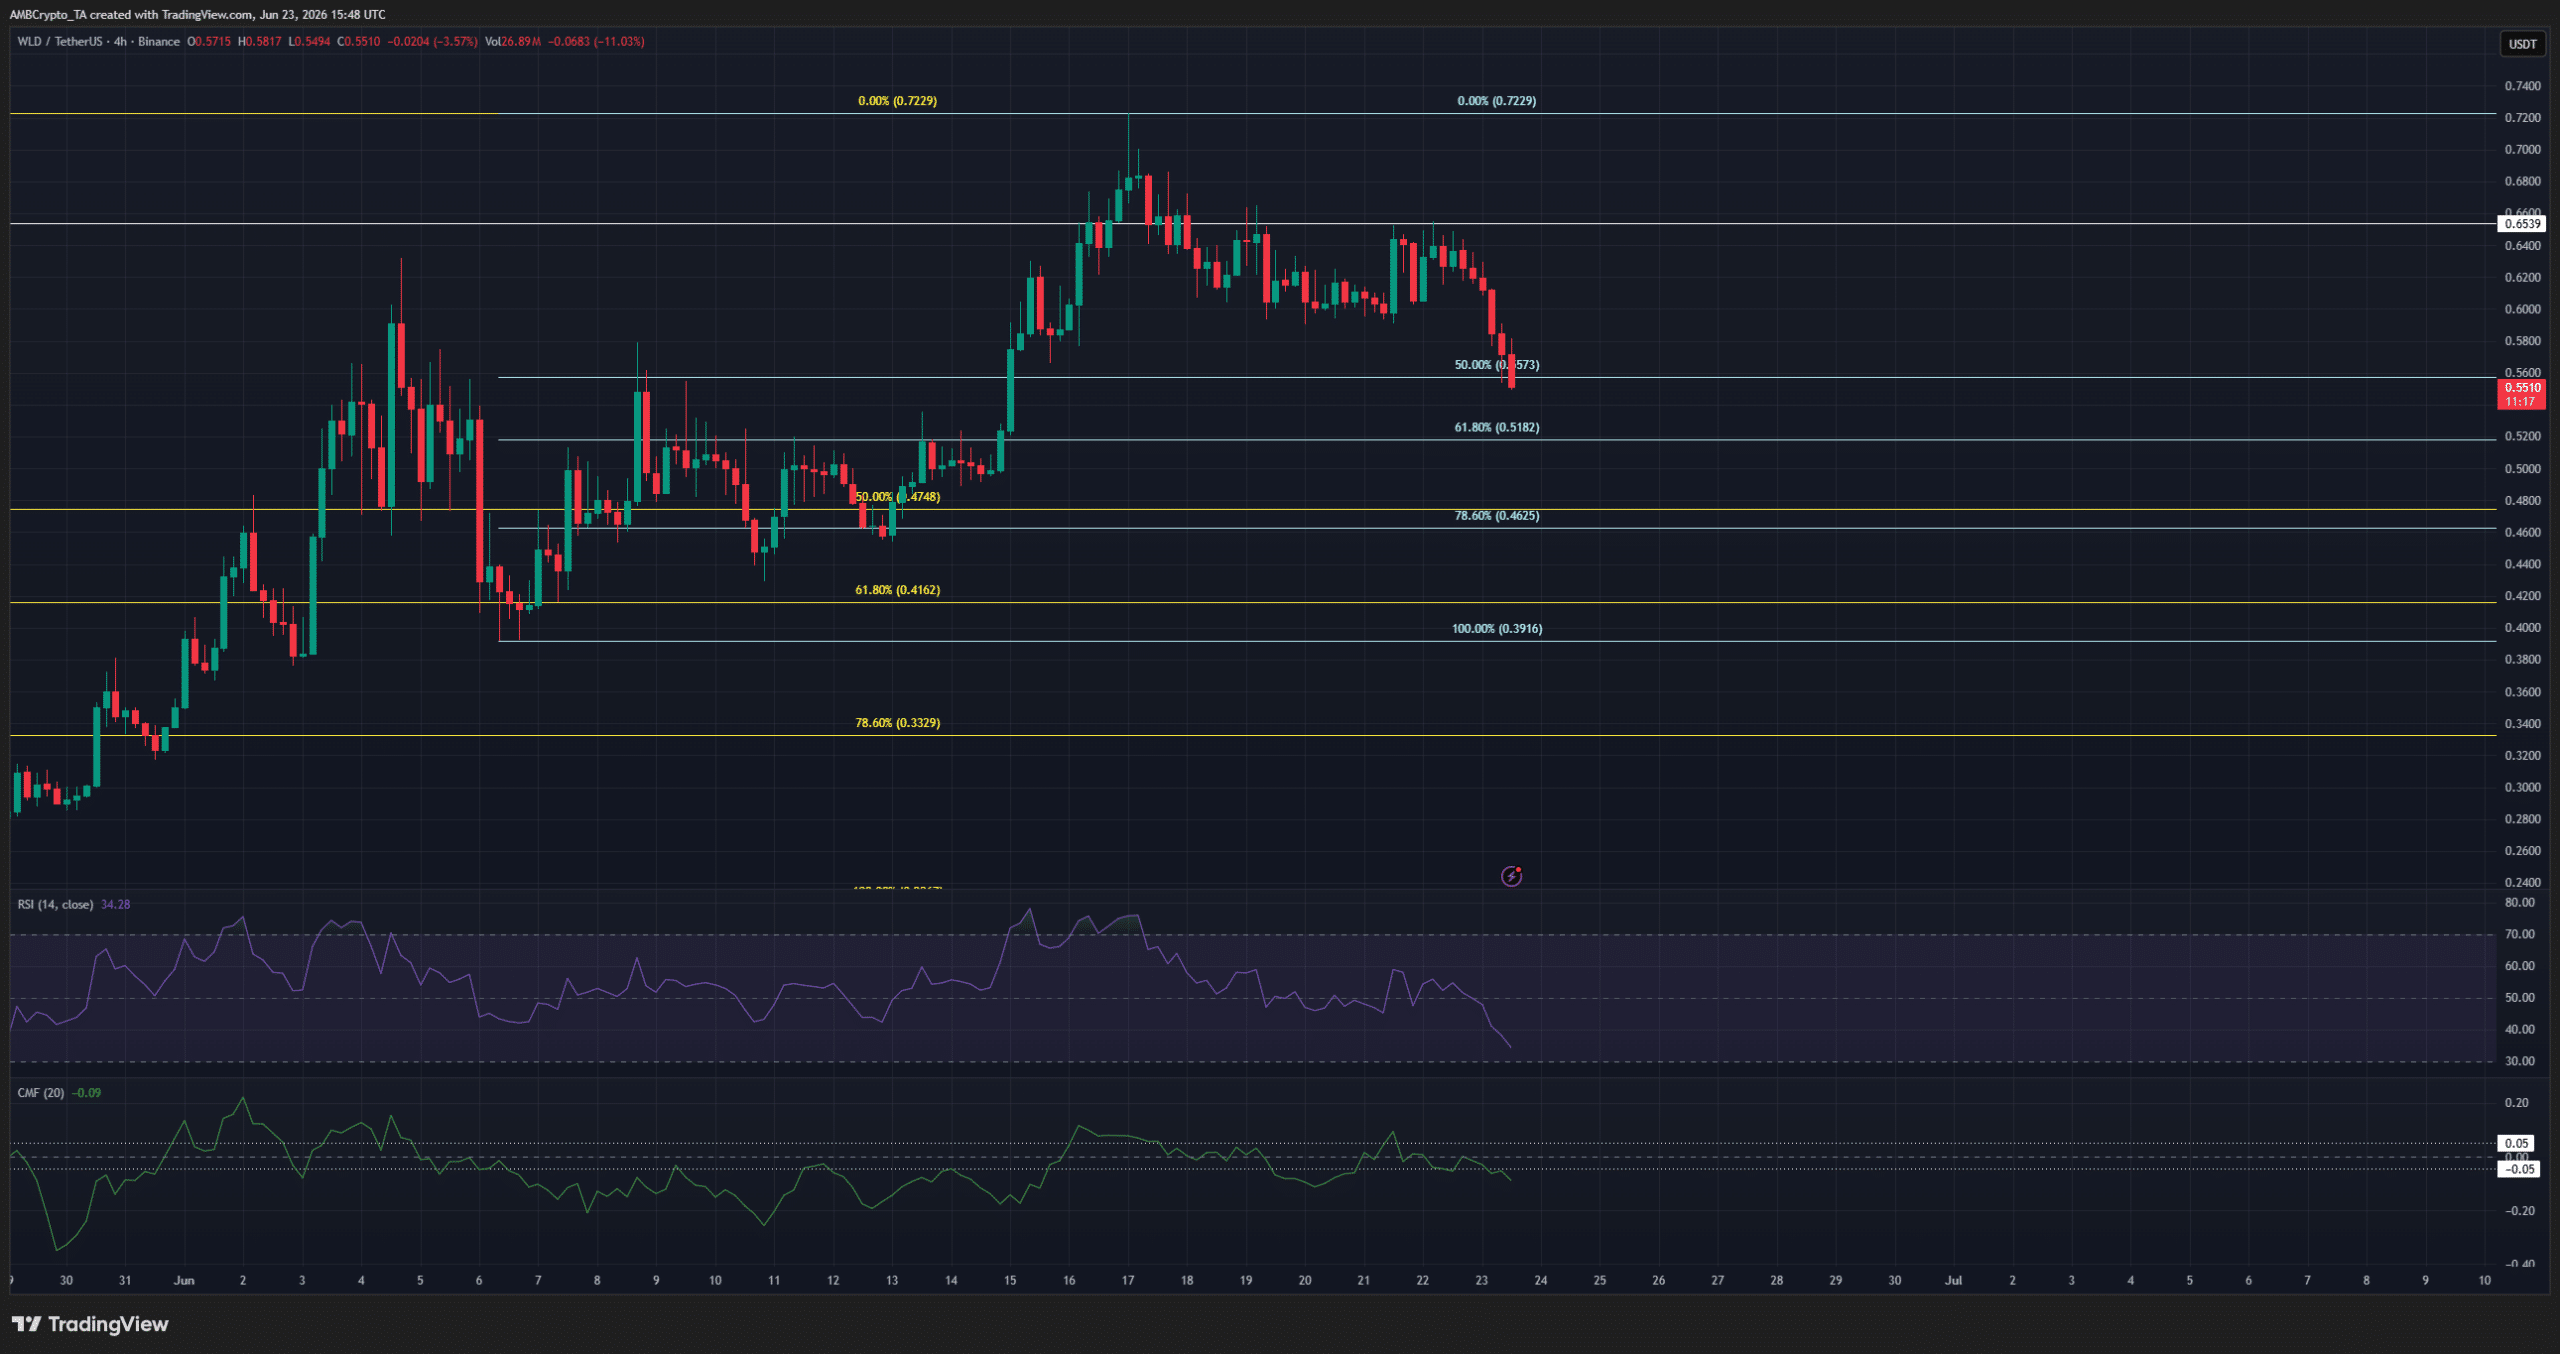
The 4-hour structure was bullish, with the $0.462-$0.518 area being the golden pocket for buyers. A drop below $0.391 would invalidate the bullish H4 structure, and serve as a warning of a deeper retracement toward $0.332.
The technical indicators on this timeframe were leaning bearish. The RSI had dropped to 34, signaling hefty downward momentum recently. The CMF slid below -0.05, showing heightened capital outflows and selling pressure.
Overall, the key WLD demand zones were clearly visible, and cautious bullishness was warranted. At the same time, a Bitcoin slide below $60k could lead to a deeper reset.
Final Summary
- The Worldcoin price action was firmly bearish in recent days, and the altcoin has shed 22% in under a week.
- Despite this correction, there was a chance that WLD bulls would manage to defend important support levels and keep the upward move going in the coming weeks.